Tracing
FSM allows optional deployment of Jaeger for tracing. Similarly, tracing can be enabled and customized during installation (tracing section in values.yaml) or at runtime by editing the fsm-mesh-config custom resource. Tracing can be enabled, disabled and configured at any time to support BYO scenarios.
When FSM is deployed with tracing enabled, the FSM control plane will use the user-provided tracing information to direct the Pipy to send traces when and where appropriate. If tracing is enabled without user-provided values, it will use the defaults in values.yaml. The tracing-address value tells all Pipy injected by FSM the FQDN to send tracing information to.
FSM supports tracing with applications that use Zipkin protocol.
Jaeger
Jaeger is an open source distributed tracing system used for monitoring and troubleshooting distributed systems. It allows you to get fine-grained metrics and distributed tracing information across your setup so that you can observe which microservices are communicating, where requests are going, and how long they are taking. You can use it to inspect for specific requests and responses to see how and when they happen.
When tracing is enabled, Jaeger is capable of receiving spans from Pipy in the mesh that can then be viewed and queried on Jaeger’s UI via port-forwarding.
FSM CLI offers the capability to deploy a Jaeger instance with FSM’s installation, but bringing your own managed Jaeger and configuring FSM’s tracing to point to it later is also supported.
Automatically Provision Jaeger
By default, Jaeger deployment and tracing as a whole is disabled.
A Jaeger instance can be automatically deployed by using the --set=fsm.deployJaeger=true FSM CLI flag at install time. This will provision a Jaeger pod in the mesh namespace.
Additionally, FSM has to be instructed to enable tracing on the proxies; this is done via the tracing section on the MeshConfig.
The following command will both deploy Jaeger and configure the tracing parameters according to the address of the newly deployed instance of Jaeger during FSM installation:
fsm install --set=fsm.deployJaeger=true,fsm.tracing.enable=true
This default bring-up uses the All-in-one Jaeger executable that launches the Jaeger UI, collector, query, and agent.
BYO (Bring-your-own)
This section documents the additional steps needed to allow an already running instance of Jaeger to integrate with your FSM control plane.
NOTE: This guide outlines steps specifically for Jaeger but you may use your own tracing application instance with applicable values. FSM supports tracing with applications that use Zipkin protocol
Prerequisites
- A running Jaeger instance
- Getting started with Jaeger includes a sample app as a demo
Tracing Values
The sections below outline how to make required updates depending on whether you already already have FSM installed or are deploying tracing and Jaeger during FSM installation. In either case, the following tracing values in values.yaml are being updated to point to your Jaeger instance:
enable: set totrueto tell the Pipy connection manager to send tracing data to a specific address (cluster)address: set to the destination cluster of your Jaeger instanceport: set to the destination port for the listener that you intend to useendpoint: set to the destination’s API or collector endpoint where the spans will be sent to
a) Enable tracing after FSM control plane has already been installed
If you already have FSM running, tracing values must be updated in the FSM MeshConfig using:
# Tracing configuration with sample values
kubectl patch meshconfig fsm-mesh-config -n fsm-system -p '{"spec":{"observability":{"tracing":{"enable":true,"address": "jaeger.fsm-system.svc.cluster.local","port":9411,"endpoint":"/api/v2/spans"}}}}'  --type=merge
You can verify these changes have been deployed by inspecting the fsm-mesh-config resource:
kubectl get meshconfig fsm-mesh-config -n fsm-system -o jsonpath='{.spec.observability.tracing}{"\n"}'
b) Enable tracing at FSM control plane install time
To deploy your own instance of Jaeger during FSM installation, you can use the --set flag as shown below to update the values:
fsm install --set fsm.tracing.enable=true,fsm.tracing.address=<tracing server hostname>,fsm.tracing.port=<tracing server port>,fsm.tracing.endpoint=<tracing server endpoint>
View the Jaeger UI with Port-Forwarding
Jaeger’s UI is running on port 16686. To view the web UI, you can use kubectl port-forward:
fsm_POD=$(kubectl get pods -n "$K8S_NAMESPACE" --no-headers  --selector app=jaeger | awk 'NR==1{print $1}')

kubectl port-forward -n "$K8S_NAMESPACE" "$fsm_POD"  16686:16686
Navigate to http://localhost:16686/ in a web browser to view the UI.
Example of Tracing with Jaeger
This section walks through the process of creating a simple Jaeger instance and enabling tracing with Jaeger in FSM.
Run the FSM Demo with Jaeger deployed. You have two options:
For automatic provisioning of Jaeger, simply set
DEPLOY_JAEGERin your.envfile to trueFor bring-your-own, you can deploy the sample instance provided by Jaeger using the commands below. If you wish to bring up Jaeger in a different namespace, make sure to update it below.
Create the Jaeger service.
kubectl apply -f - <<EOF
---
kind: Service
apiVersion: v1
metadata:
  name: jaeger
  namespace: fsm-system
  labels:
    app: jaeger
spec:
  selector:
    app: jaeger
  ports:
  - protocol: TCP
    # Service port and target port are the same
    port: 9411
  type: ClusterIP
EOF
Create the Jaeger deployment.
kubectl apply -f - <<EOF
---
apiVersion: apps/v1
kind: Deployment
metadata:
  name: jaeger
  namespace: fsm-system
  labels:
    app: jaeger
spec:
  replicas: 1
  selector:
    matchLabels:
      app: jaeger
  template:
    metadata:
      labels:
        app: jaeger
    spec:
      containers:
      - name: jaeger
        image: jaegertracing/all-in-one
        args:
          - --collector.zipkin.host-port=9411
        imagePullPolicy: IfNotPresent
        ports:
        - containerPort: 9411
        resources:
          limits:
            cpu: 500m
            memory: 512M
          requests:
            cpu: 100m
            memory: 256M
EOF
Enable tracing and pass in applicable values. If you have installed Jaeger in a different namespace, replace
fsm-systembelow.kubectl patch meshconfig fsm-mesh-config -n fsm-system -p '{"spec":{"observability":{"tracing":{"enable":true,"address": "jaeger.fsm-system.svc.cluster.local","port":9411,"endpoint":"/api/v2/spans"}}}}' --type=mergeRefer to instructions above to view the web UI using port forwarding
In the browser, you should see a
Servicedropdown which allows you to select from the various applications deployed by the bookstore demo.a) Select a service to view all spans from it. For example, if you select
bookbuyerwith aLookbackof one hour, you can see its interactions withbookstore-v1andbookstore-v2sorted by time.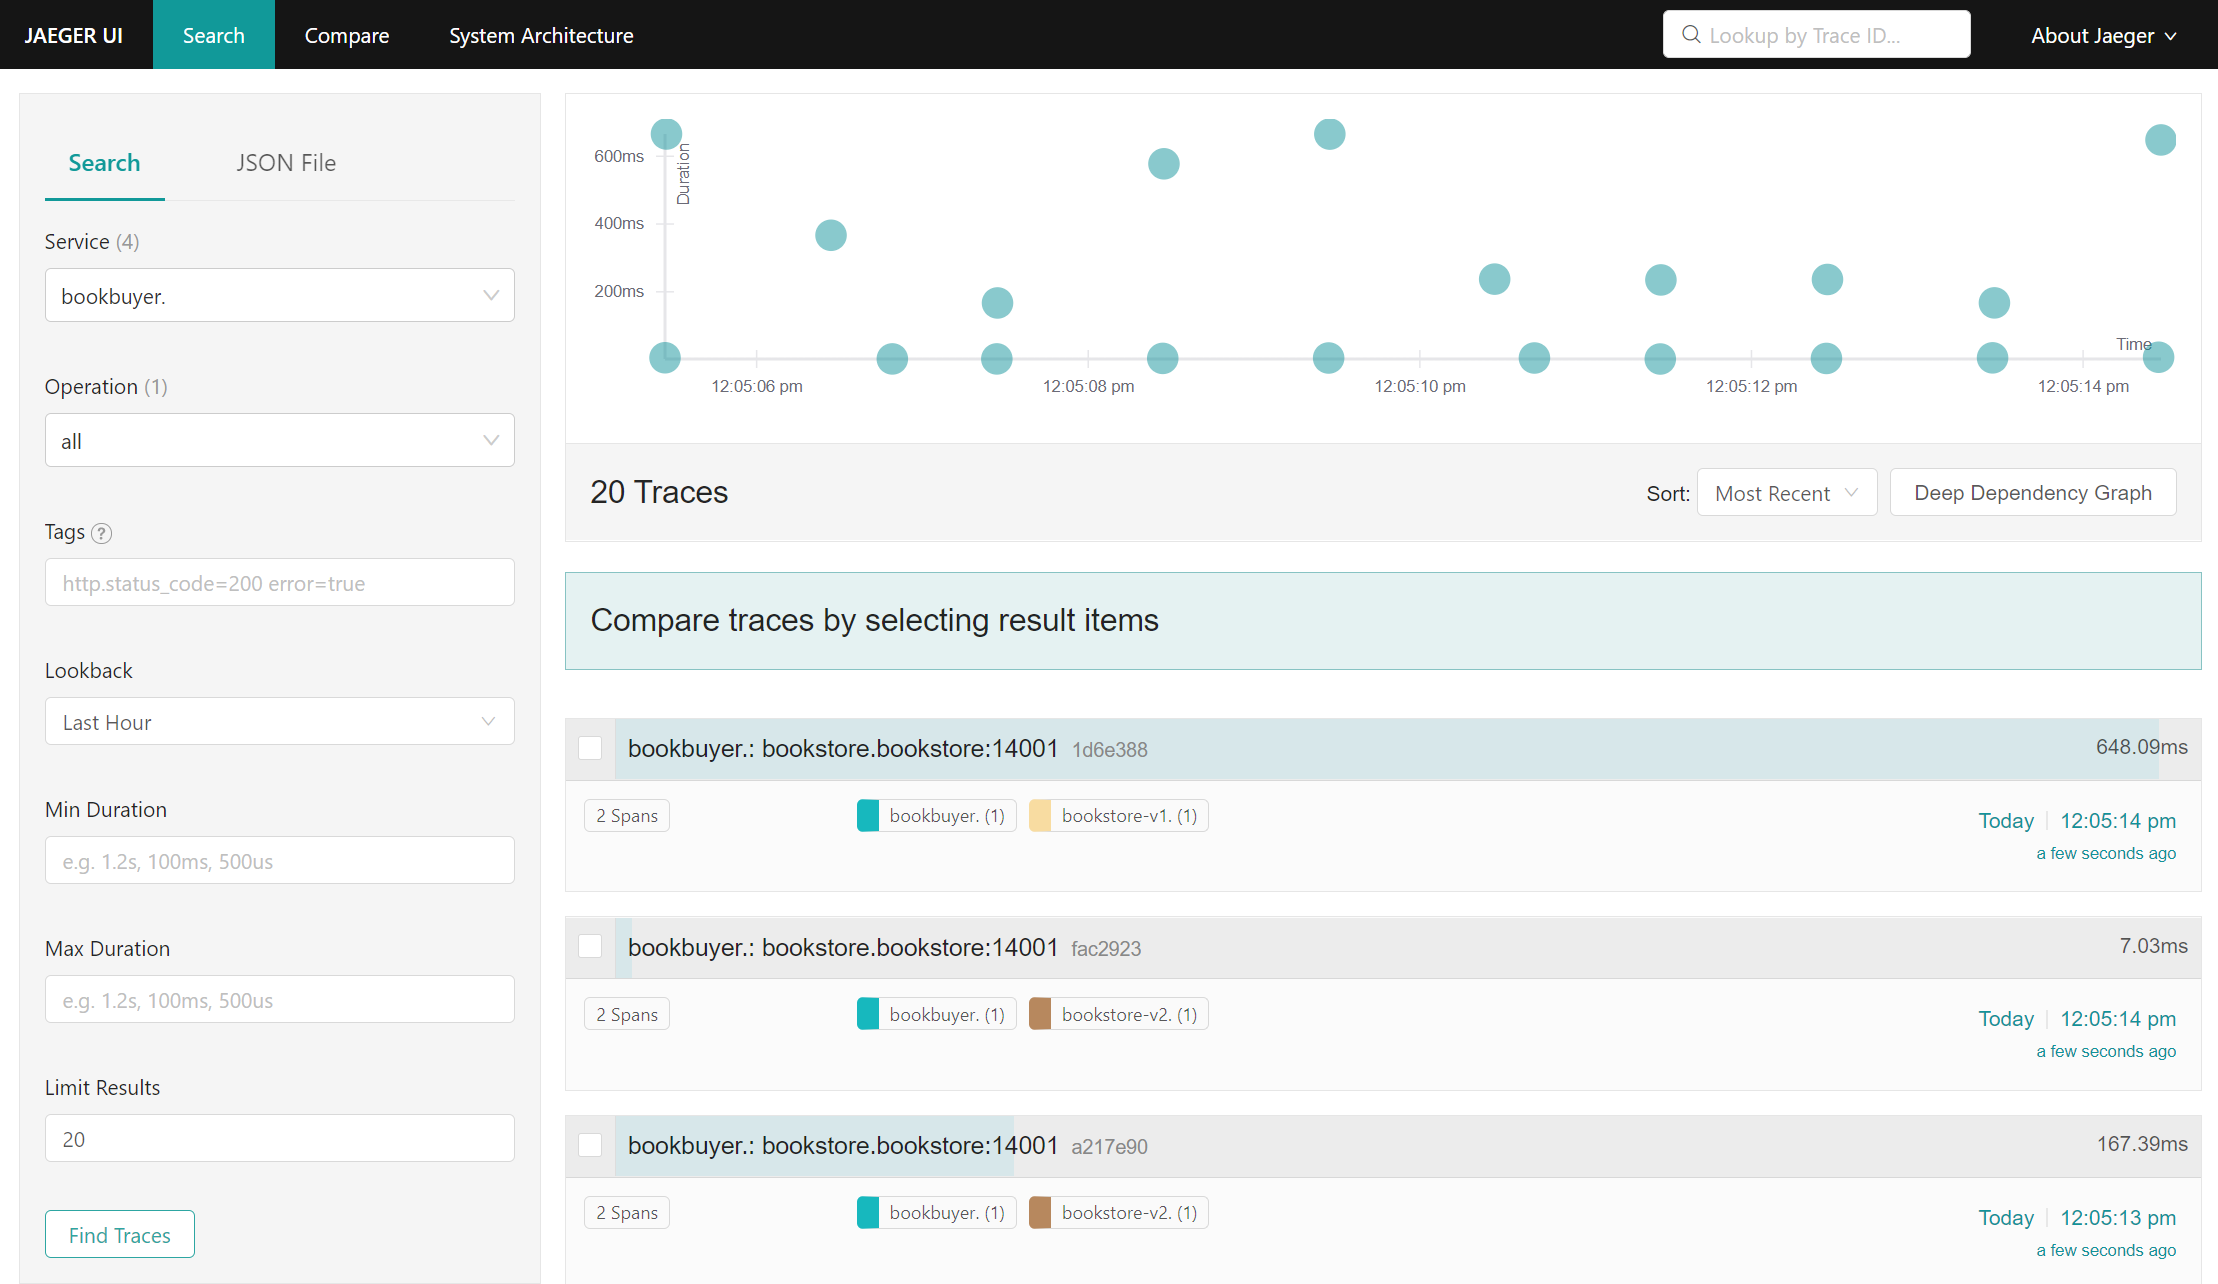
Jaeger UI search for bookbuyer traces b) Click on any item to view it in further detail
c) Select multiple items to compare traces. For example, you can compare the
bookbuyer’s interactions withbookstore-v1andbookstore-v2at a particular moment in time: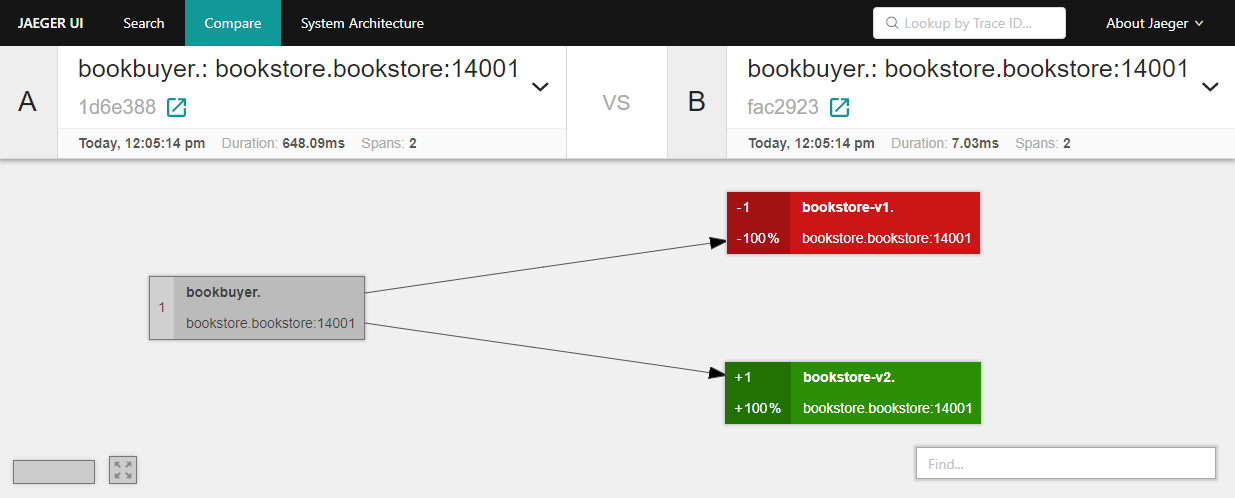
bookbuyer interactions with bookstore-v1 and bookestore-v2 d) Click on the
System Architecturetab to view a graph of how the various applications have been interacting/communicating. This provides an idea of how traffic is flowing between the applications.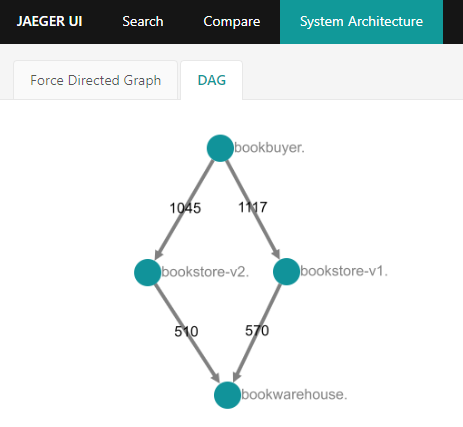
Directed acyclic graph of bookstore demo application interactions
If you are not seeing the bookstore demo applications in the Jaeger UI, tail the bookbuyer logs to ensure that the applications are successfully interacting.
POD="$(kubectl get pods -n "$BOOKBUYER_NAMESPACE" --show-labels --selector app=bookbuyer --no-headers | grep -v 'Terminating' | awk '{print $1}' | head -n1)"

kubectl logs "${POD}" -n "$BOOKBUYER_NAMESPACE" -c bookbuyer --tail=100 -f
Expect to see:
"MAESTRO! THIS TEST SUCCEEDED!"
This suggests that the issue is not caused by your Jaeger or tracing configuration.
Integrate Jaeger Tracing In Your Application
Jaeger tracing does not come effort-free. In order for Jaeger to connect requests to traces automatically, it is the application’s responsibility to publish the tracing information correctly.
In Open Service Mesh’s sidecar proxy configuration, currently Zipkin is used as the HTTP tracer. Therefore an application can leverage Zipkin supported headers to provide tracing information. In the initial request of a trace, the Zipkin plugin will generate the required HTTP headers. An application should propagate the headers below if it needs to add subsequent requests to the current trace:
x-request-idx-b3-traceidx-b3-spanidx-b3-parentspanid
Troubleshoot Tracing/Jaeger
When tracing is not working as expected.
1. Verify that tracing is enabled
Ensure the enable key in the tracing configuration is set to true:
kubectl get meshconfig fsm-mesh-config -n fsm-system -o jsonpath='{.spec.observability.tracing.enable}{"\n"}'
true
2. Verify the tracing values being set are as expected
If tracing is enabled, you can verify the specific address, port and endpoint being used for tracing in the fsm-mesh-config resource:
kubectl get meshconfig fsm-mesh-config -n fsm-system -o jsonpath='{.spec.observability.tracing}{"\n"}'
To verify that the Pipy point to the FQDN you intend to use, check the value for the address key.
3. Verify the tracing values being used are as expected
To dig one level deeper, you may also check whether the values set by the MeshConfig are being correctly used. Use the command below to get the config dump of the pod in question and save the output in a file.
fsm proxy get config_dump -n <pod-namespace> <pod-name> > <file-name>
Open the file in your favorite text editor and search for pipy-tracing-cluster. You should be able to see the tracing values in use. Example output for the bookbuyer pod:
"name": "pipy-tracing-cluster",
      "type": "LOGICAL_DNS",
      "connect_timeout": "1s",
      "alt_stat_name": "pipy-tracing-cluster",
      "load_assignment": {
       "cluster_name": "pipy-tracing-cluster",
       "endpoints": [
        {
         "lb_endpoints": [
          {
           "endpoint": {
            "address": {
             "socket_address": {
              "address": "jaeger.fsm-system.svc.cluster.local",
              "port_value": 9411
        [...]
4. Verify that the FSM Controller was installed with Jaeger automatically deployed [optional]
If you used automatic bring-up, you can additionally check for the Jaeger service and Jaeger deployment:
# Assuming FSM is installed in the fsm-system namespace:
kubectl get services -n fsm-system -l app=jaeger

NAME     TYPE        CLUSTER-IP   EXTERNAL-IP   PORT(S)    AGE
jaeger   ClusterIP   10.99.2.87   <none>        9411/TCP   27m
# Assuming FSM is installed in the fsm-system namespace:
kubectl get deployments -n fsm-system -l app=jaeger

NAME     READY   UP-TO-DATE   AVAILABLE   AGE
jaeger   1/1     1            1           27m
5. Verify Jaeger pod readiness, responsiveness and health
Check if the Jaeger pod is running in the namespace you have deployed it in:
The commands below are specific to FSM’s automatic deployment of Jaeger; substitute namespace and label values for your own tracing instance as applicable:
kubectl get pods -n fsm-system -l app=jaeger

NAME                     READY   STATUS    RESTARTS   AGE
jaeger-8ddcc47d9-q7tgg   1/1     Running   5          27m
To get information about the Jaeger instance, use kubectl describe pod and check the Events in the output.
kubectl describe pod -n fsm-system -l app=jaeger
External Resources
Feedback
Was this page helpful?
Glad to hear it! Please tell us how we can improve.
Sorry to hear that. Please tell us how we can improve.