This is the multi-page printable view of this section. Click here to print.
Observability
1 - Metrics
FSM generates detailed metrics related to all traffic within the mesh and the FSM control plane. These metrics provide insights into the behavior of applications in the mesh and the mesh itself helping users to troubleshoot, maintain and analyze their applications.
FSM collects metrics directly from the sidecar proxies (Pipy). With these metrics the user can get information about the overall volume of traffic, errors within traffic and the response time for requests.
Additionally, FSM generates metrics for the control plane components. These metrics can be used to monitor the behavior and health of the service mesh.
FSM uses Prometheus to gather and store consistent traffic metrics and statistics for all applications running in the mesh. Prometheus is an open-source monitoring and alerting toolkit which is commonly used on (but not limited to) Kubernetes and Service Mesh environments.
Each application that is part of the mesh runs in a Pod which contains an Pipy sidecar that exposes metrics (proxy metrics) in the Prometheus format. Furthermore, every Pod that is a part of the mesh and in a namespace with metrics enabled has Prometheus annotations, which makes it possible for the Prometheus server to scrape the application dynamically. This mechanism automatically enables scraping of metrics whenever a pod is added to the mesh.
FSM metrics can be viewed with Grafana which is an open source visualization and analytics software. It allows you to query, visualize, alert on, and explore your metrics.
Grafana uses Prometheus as backend timeseries database. If Grafana and Prometheus are chosen to be deployed through FSM installation, necessary rules will be set upon deployment for them to interact. Conversely, on a “Bring-Your-Own” or “BYO” model (further explained below), installation of these components will be taken care of by the user.
Installing Metrics Components
FSM can either provision Prometheus and Grafana instances at install time or FSM can connect to an existing Prometheus and/or Grafana instance. We call the latter pattern “Bring-Your-Own” or “BYO”. The sections below describe how to configure metrics by allowing FSM to automatically provision the metrics components and with the BYO method.
Automatic Provisioning
By default, both Prometheus and Grafana are disabled.
However, when configured with the --set=fsm.deployPrometheus=true flag, FSM installation will deploy a Prometheus instance to scrape the sidecar’s metrics endpoints. Based on the metrics scraping configuration set by the user, FSM will annotate pods part of the mesh with necessary metrics annotations to have Prometheus reach and scrape the pods to collect relevant metrics. The scraping configuration file defines the default Prometheus behavior and the set of metrics collected by FSM.
To install Grafana for metrics visualization, pass the --set=fsm.deployGrafana=true flag to the fsm install command. FSM provides a pre-configured dashboard that is documented in FSM Grafana dashboards.
 fsm install --set=fsm.deployPrometheus=true \
             --set=fsm.deployGrafana=true
Note: The Prometheus and Grafana instances deployed automatically by FSM have simple configurations that do not include high availability, persistent storage, or locked down security. If production-grade instances are required, pre-provision them and follow the BYO instructions on this page to integrate them with FSM.
Bring-Your-Own
Prometheus
The following section documents the additional steps needed to allow an already running Prometheus instance to poll the endpoints of an FSM mesh.
List of Prerequisites for BYO Prometheus
- Already running an accessible Prometheus instance outside of the mesh.
- A running FSM control plane instance, deployed without metrics stack.
- We will assume having Grafana reach Prometheus, exposing or forwarding Prometheus or Grafana web ports and configuring Prometheus to reach Kubernetes API services is taken care of or otherwise out of the scope of these steps.
Configuration
- Make sure the Prometheus instance has appropriate RBAC rules to be able to reach both the pods and Kubernetes API - this might be dependent on specific requirements and situations for different deployments:
- apiGroups: [""]
  resources: ["nodes", "nodes/proxy",  "nodes/metrics", "services", "endpoints", "pods", "ingresses", "configmaps"]
  verbs: ["list", "get", "watch"]
- apiGroups: ["extensions"]
  resources: ["ingresses", "ingresses/status"]
  verbs: ["list", "get", "watch"]
- nonResourceURLs: ["/metrics"]
  verbs: ["get"]
- If desired, use the Prometheus Service definition to allow Prometheus to scrape itself:
annotations:
  prometheus.io/scrape: "true"
  prometheus.io/port: "<API port for prometheus>" # Depends on deployment - FSM automatic deployment uses 7070 by default, controlled by `values.yaml`
- Amend Prometheus’ configmap to reach the pods/Pipy endpoints. FSM automatically appends the port annotations to the pods and takes care of pushing the listener configuration to the pods for Prometheus to reach:
- job_name: 'kubernetes-pods'
  kubernetes_sd_configs:
  - role: pod
  relabel_configs:
  - source_labels: [__meta_kubernetes_pod_annotation_prometheus_io_scrape]
    action: keep
    regex: true
  - source_labels: [__meta_kubernetes_pod_annotation_prometheus_io_path]
    action: replace
    target_label: __metrics_path__
    regex: (.+)
  - source_labels: [__address__, __meta_kubernetes_pod_annotation_prometheus_io_port]
    action: replace
    regex: ([^:]+)(?::\d+)?;(\d+)
    replacement: $1:$2
    target_label: __address__
  - source_labels: [__meta_kubernetes_namespace]
    action: replace
    target_label: source_namespace
  - source_labels: [__meta_kubernetes_pod_name]
    action: replace
    target_label: source_pod_name
  - regex: '(__meta_kubernetes_pod_label_app)'
    action: labelmap
    replacement: source_service
  - regex: '(__meta_kubernetes_pod_label_fsm_sidecar_uid|__meta_kubernetes_pod_label_pod_template_hash|__meta_kubernetes_pod_label_version)'
    action: drop
  - source_labels: [__meta_kubernetes_pod_controller_kind]
    action: replace
    target_label: source_workload_kind
  - source_labels: [__meta_kubernetes_pod_controller_name]
    action: replace
    target_label: source_workload_name
  - source_labels: [__meta_kubernetes_pod_controller_kind]
    action: replace
    regex: ^ReplicaSet$
    target_label: source_workload_kind
    replacement: Deployment
  - source_labels:
    - __meta_kubernetes_pod_controller_kind
    - __meta_kubernetes_pod_controller_name
    action: replace
    regex: ^ReplicaSet;(.*)-[^-]+$
    target_label: source_workload_name
Grafana
The following section assumes a Prometheus instance has already been configured as a data source for a running Grafana instance. Refer to the Prometheus and Grafana demo for an example on how to create and configure a Grafana instance.
Importing FSM Dashboards
FSM Dashboards are available through our repository, which can be imported as json blobs on the web admin portal.
Detailed instructions for importing FSM dashboards can be found in the Prometheus and Grafana demo. Refer to FSM Grafana dashboard for an overview of the pre-configured dashboards.
Metrics scraping
Metrics scraping can be configured using the fsm metrics command. By default, FSM does not configure metrics scraping for pods in the mesh. Metrics scraping can be enabled or disabled at namespace scope such that pods belonging to configured namespaces can be enabled or disabled for scraping metrics.
For metrics to be scraped, the following prerequisites must be met:
- The namespace must be a part of the mesh, ie. it must be labeled with the
flomesh.io/monitored-bylabel with an appropriate mesh name. This can be done using thefsm namespace addcommand. - A running service able to scrape Prometheus endpoints. FSM provides configuration for an automatic bringup of Prometheus; alternatively users can bring their own Prometheus.
To enable one or more namespaces for metrics scraping:
fsm metrics enable --namespace test
fsm metrics enable --namespace "test1, test2"
To disable one or more namespaces for metrics scraping:
fsm metrics disable --namespace test
fsm metrics disable --namespace "test1, test2"
Enabling metrics scraping on a namespace also causes the fsm-injector to add the following annotations to pods in that namespace:
prometheus.io/scrape: true
prometheus.io/port: 15010
prometheus.io/path: /stats/prometheus
Available Metrics
FSM exports metrics about the traffic within the mesh as well as metrics about the control plane.
Custom Pipy Metrics
To implement the SMI Metrics Specification, the Pipy proxy in FSM generates the following statistics for HTTP traffic
fsm_request_total: a counter metric that is self-incrementing with each proxy request. By querying this metric, you can see the success and failure rates of requests for the services in the mesh.
fsm_request_duration_ms: A histogram metric that indicates the duration of a proxy request in milliseconds. This metric is queried to understand the latency between services in the mesh.
Both metrics have the following labels.
source_kind: the Kubernetes resource type of the workload that generated the request, e.g. Deployment, DaemonSet, etc.
destination_kind: The Kubernetes resource type that processes the requested workload, e.g. Deployment, DaemonSet, etc.
source_name: The name of the Kubernetes that generated the requested workload.
destination_name: The name of the Kubernetes that processed the requested workload.
source_pod: the name of the pod in Kubernetes that generated the request.
destination_pod: the name of the pod that processed the request in Kubernetes.
source_namespace: the namespace in Kubernetes of the workload that generated the request.
destination_namespace: the namespace in Kubernetes of the workload that processed the request.
In addition, the fsm_request_total metric has a response_code tag that indicates the HTTP status code of the request, e.g. 200, 404, etc.
Control Plane
The following metrics are exposed in the Prometheus format by the FSM control plane components. The fsm-controller and fsm-injector pods have the following Prometheus annotation.
annotations:
   prometheus.io/scrape: 'true'
   prometheus.io/port: '9091'
| Metric | Type | Labels | Description |
|---|---|---|---|
| fsm_k8s_api_event_count | Count | type, namespace | Number of events received from the Kubernetes API Server |
| fsm_proxy_connect_count | Gauge | Number of proxies connected to FSM controller | |
| fsm_proxy_reconnect_count | Count | IngressGateway defines the certificate specification for an ingress gateway | |
| fsm_proxy_response_send_success_count | Count | proxy_uuid, identity, type | Number of responses successfully sent to proxies |
| fsm_proxy_response_send_error_count | Count | proxy_uuid, identity, type | Number of responses that errored when being set to proxies |
| fsm_proxy_config_update_time | Histogram | resource_type, success | Histogram to track time spent for proxy configuration |
| fsm_proxy_broadcast_event_count | Count | Number of ProxyBroadcast events published by the FSM controller | |
| fsm_proxy_xds_request_count | Count | proxy_uuid, identity, type | Number of XDS requests made by proxies |
| fsm_proxy_max_connections_rejected | Count | Number of proxy connections rejected due to the configured max connections limit | |
| fsm_cert_issued_count | Count | Total number of XDS certificates issued to proxies | |
| fsm_cert_issued_time | Histogram | Histogram to track time spent to issue xds certificate | |
| fsm_admission_webhook_response_total | Count | kind, success | Total number of admission webhook responses generated |
| fsm_error_err_code_count | Count | err_code | Number of errcodes generated by FSM |
| fsm_http_response_total | Count | code, method, path | Number of HTTP responses sent |
| fsm_http_response_duration | Histogram | code, method, path | Duration in seconds of HTTP responses sent |
| fsm_feature_flag_enabled | Gauge | feature_flag | Represents whether a feature flag is enabled (1) or disabled (0) |
| fsm_conversion_webhook_resource_total | Count | kind, success, from_version, to_version | Number of resources converted by conversion webhooks |
| fsm_events_queued | Gauge | Number of events seen but not yet processed by the control plane | |
| fsm_reconciliation_total | Count | kind | Counter of resource reconciliations invoked |
Error Code Metrics
When an error occurs in the FSM control plane the ErrCodeCounter Prometheus metric is incremented for the related FSM error code. For the complete list of error codes and their descriptions, see FSM Control Plane Error Code Troubleshooting Guide.
The fully-qualified name of the error code metric is fsm_error_err_code_count.
Note: Metrics corresponding to errors that result in process restarts might not be scraped in time.
Query metrics from Prometheus
Before you begin
Ensure that you have followed the steps to run FSM Demo
Querying proxy metrics for request count
- Verify that the Prometheus service is running in your cluster
- In kubernetes, execute the following command:
kubectl get svc fsm-prometheus -n <fsm-namespace>.
- Note:
<fsm-namespace>refers to the namespace where the fsm control plane is installed.
- In kubernetes, execute the following command:
- Open up the Prometheus UI
- Ensure you are in root of the repository and execute the following script:
./scripts/port-forward-prometheus.sh - Visit the following url http://localhost:7070 in your web browser
- Ensure you are in root of the repository and execute the following script:
- Execute a Prometheus query
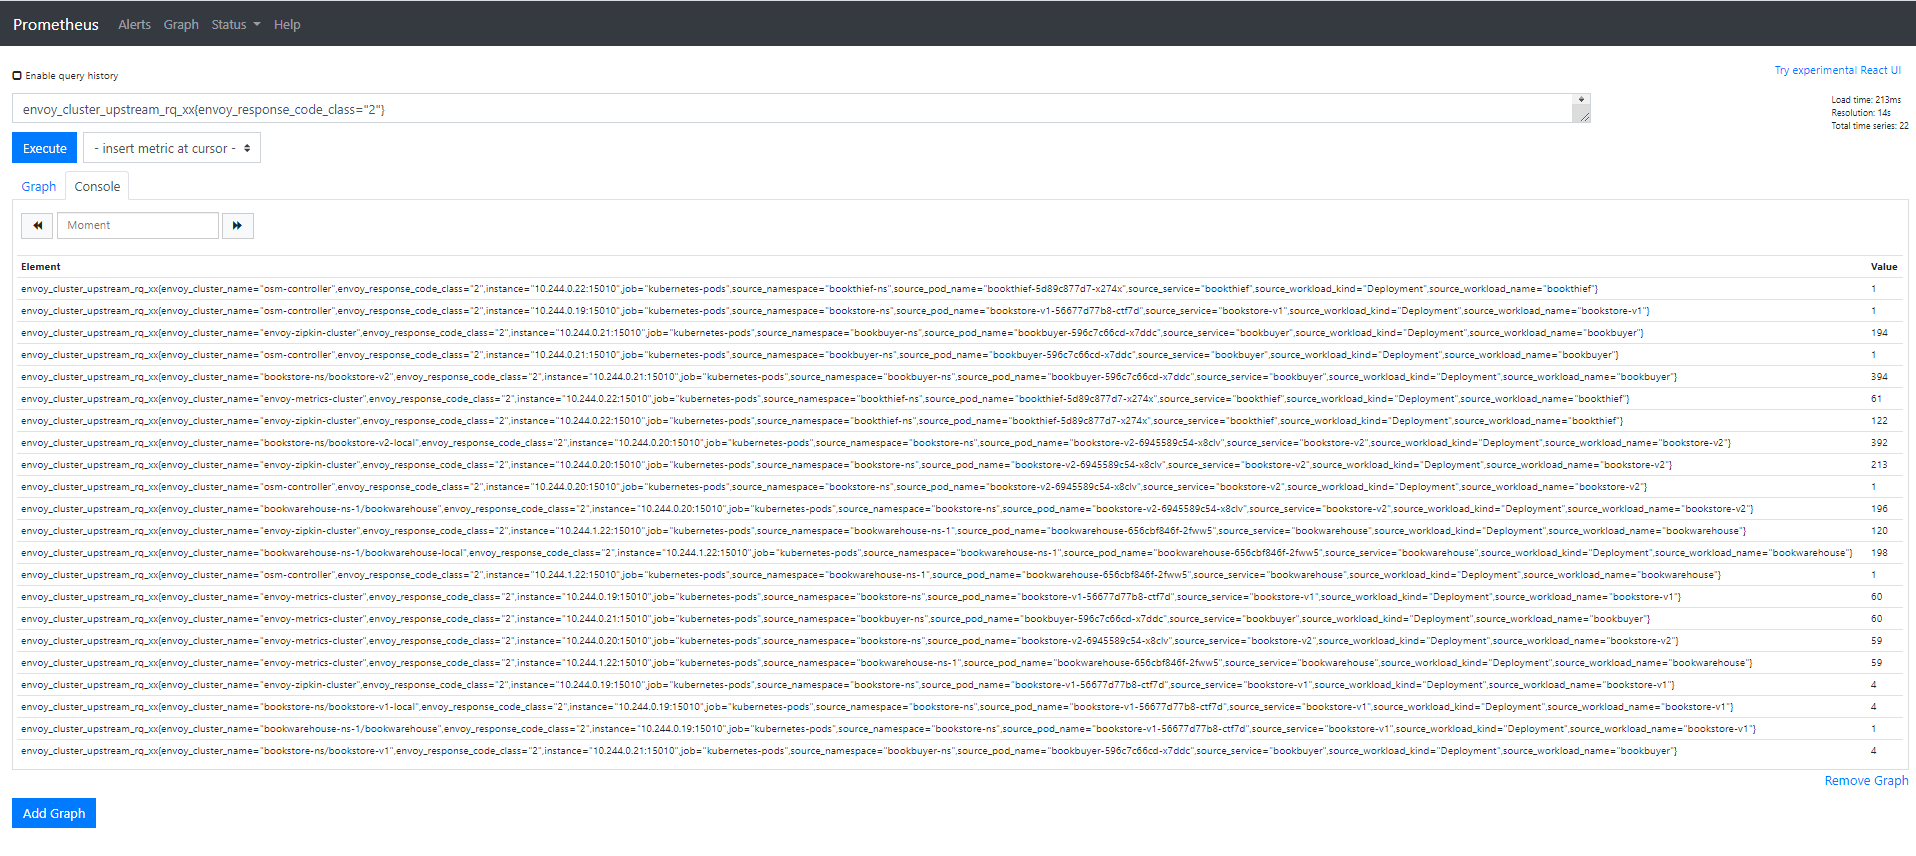
- In the “Expression” input box at the top of the web page, enter the text:
sidecar_cluster_upstream_rq_xx{sidecar_response_code_class="2"}and click the execute button - This query will return the successful http requests
- In the “Expression” input box at the top of the web page, enter the text:
Sample result will be:
Visualize metrics with Grafana
List of Prerequisites for Viewing Grafana Dashboards
Ensure that you have followed the steps to run FSM Demo
Viewing a Grafana dashboard for service to service metrics
- Verify that the Prometheus service is running in your cluster
- In kubernetes, execute the following command:
kubectl get svc fsm-prometheus -n <fsm-namespace>
- In kubernetes, execute the following command:
- Verify that the Grafana service is running in your cluster
- In kubernetes, execute the following command:
kubectl get svc fsm-grafana -n <fsm-namespace>
- In kubernetes, execute the following command:
- Open up the Grafana UI
- Ensure you are in root of the repository and execute the following script:
./scripts/port-forward-grafana.sh - Visit the following url http://localhost:3000 in your web browser
- Ensure you are in root of the repository and execute the following script:
- The Grafana UI will request for login details, use the following default settings:
- username: admin
- password: admin
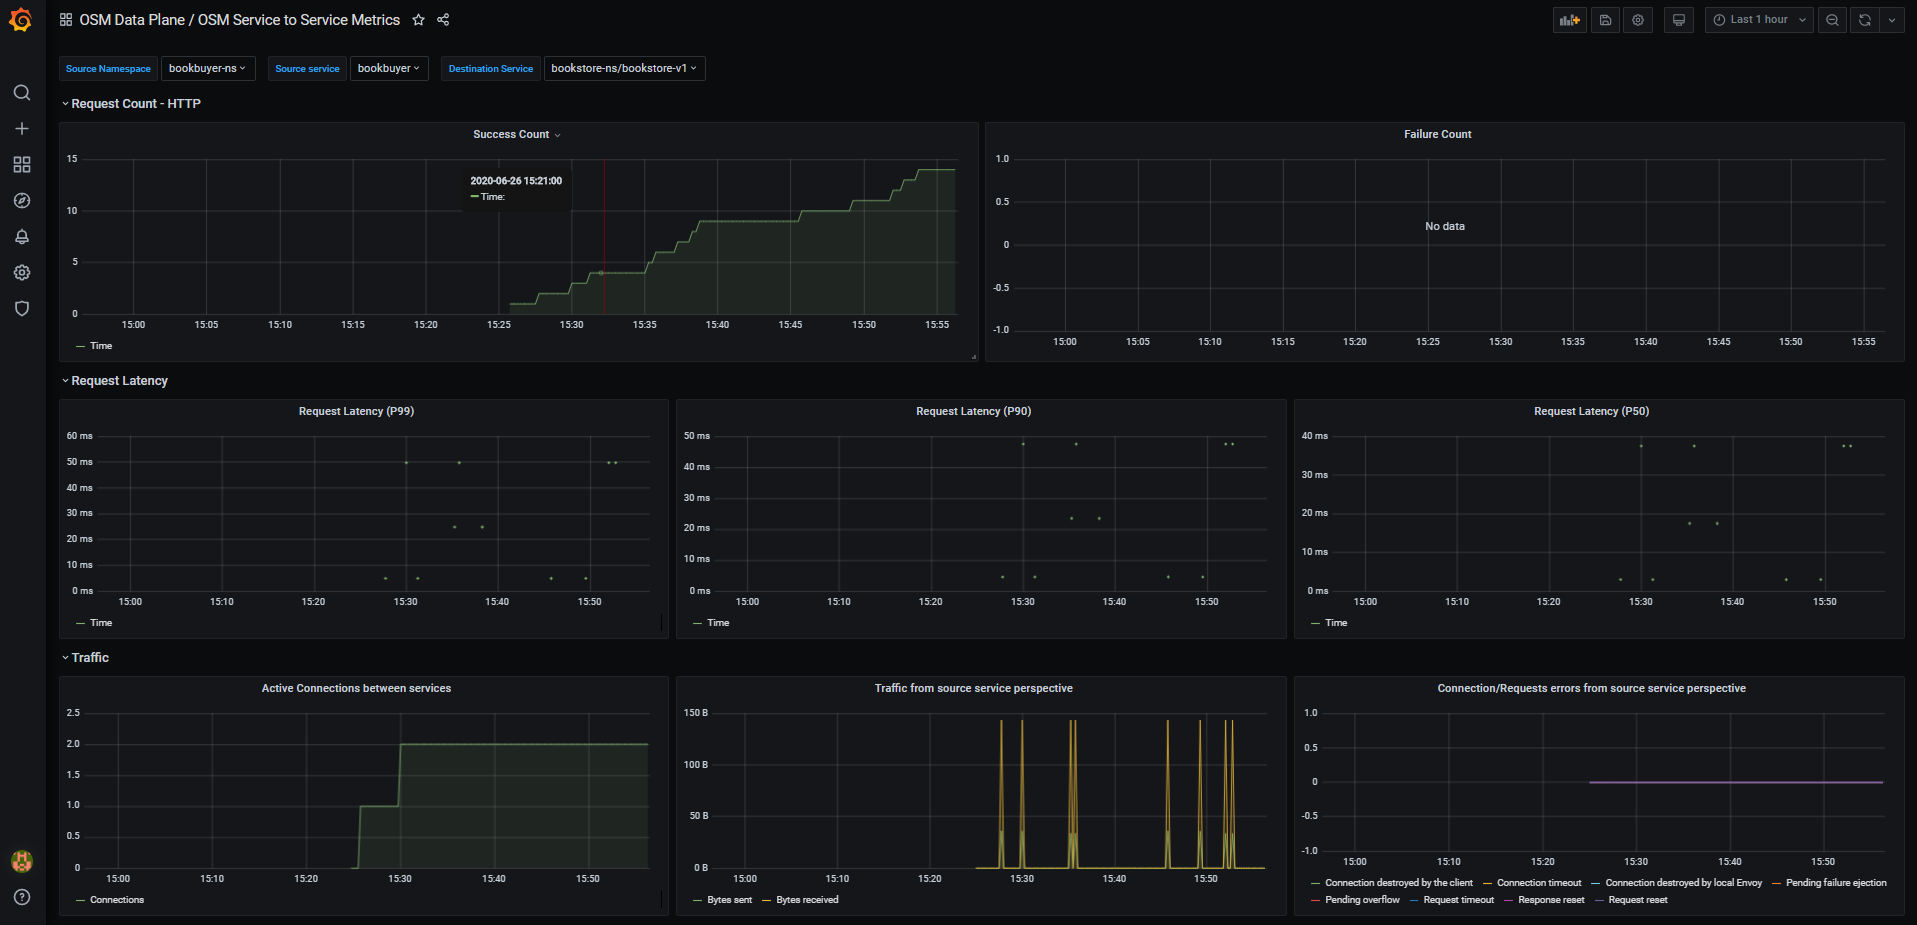
- Viewing Grafana dashboard for service to service metrics
- From the Grafana’s dashboards left hand corner navigation menu you can navigate to the FSM Service to Service Dashboard in the folder FSM Data Plane
- Or visit the following url http://localhost:3000/d/FSMs2sMetrics/fsm-service-to-service-metrics?orgId=1 in your web browser
FSM Service to Service Metrics dashboard will look like:
FSM Grafana dashboards
FSM provides some pre-cooked Grafana dashboards to display and track services related information captured by Prometheus:
FSM Data Plane
- FSM Data Plane Performance Metrics: This dashboard lets you view the performance of FSM’s data plane

- FSM Service to Service Metrics: This dashboard lets you view the traffic metrics from a given source service to a given destination service

- FSM Pod to Service Metrics: This dashboard lets you investigate the traffic metrics from a pod to all the services it connects/talks to

- FSM Workload to Service Metrics: This dashboard provides the traffic metrics from a workload (deployment, replicaSet) to all the services it connects/talks to

- FSM Workload to Workload Metrics: This dashboard displays the latencies of requests in the mesh from workload to workload

- FSM Data Plane Performance Metrics: This dashboard lets you view the performance of FSM’s data plane
FSM Control Plane
- FSM Control Plane Metrics: This dashboard provides traffic metrics from the given service to FSM’s control plane

- Mesh and Pipy Details: This dashboard lets you view the performance and behavior of FSM’s control plane

- FSM Control Plane Metrics: This dashboard provides traffic metrics from the given service to FSM’s control plane
2 - Tracing
FSM allows optional deployment of Jaeger for tracing. Similarly, tracing can be enabled and customized during installation (tracing section in values.yaml) or at runtime by editing the fsm-mesh-config custom resource. Tracing can be enabled, disabled and configured at any time to support BYO scenarios.
When FSM is deployed with tracing enabled, the FSM control plane will use the user-provided tracing information to direct the Pipy to send traces when and where appropriate. If tracing is enabled without user-provided values, it will use the defaults in values.yaml. The tracing-address value tells all Pipy injected by FSM the FQDN to send tracing information to.
FSM supports tracing with applications that use Zipkin protocol.
Jaeger
Jaeger is an open source distributed tracing system used for monitoring and troubleshooting distributed systems. It allows you to get fine-grained metrics and distributed tracing information across your setup so that you can observe which microservices are communicating, where requests are going, and how long they are taking. You can use it to inspect for specific requests and responses to see how and when they happen.
When tracing is enabled, Jaeger is capable of receiving spans from Pipy in the mesh that can then be viewed and queried on Jaeger’s UI via port-forwarding.
FSM CLI offers the capability to deploy a Jaeger instance with FSM’s installation, but bringing your own managed Jaeger and configuring FSM’s tracing to point to it later is also supported.
Automatically Provision Jaeger
By default, Jaeger deployment and tracing as a whole is disabled.
A Jaeger instance can be automatically deployed by using the --set=fsm.deployJaeger=true FSM CLI flag at install time. This will provision a Jaeger pod in the mesh namespace.
Additionally, FSM has to be instructed to enable tracing on the proxies; this is done via the tracing section on the MeshConfig.
The following command will both deploy Jaeger and configure the tracing parameters according to the address of the newly deployed instance of Jaeger during FSM installation:
fsm install --set=fsm.deployJaeger=true,fsm.tracing.enable=true
This default bring-up uses the All-in-one Jaeger executable that launches the Jaeger UI, collector, query, and agent.
BYO (Bring-your-own)
This section documents the additional steps needed to allow an already running instance of Jaeger to integrate with your FSM control plane.
NOTE: This guide outlines steps specifically for Jaeger but you may use your own tracing application instance with applicable values. FSM supports tracing with applications that use Zipkin protocol
Prerequisites
- A running Jaeger instance
- Getting started with Jaeger includes a sample app as a demo
Tracing Values
The sections below outline how to make required updates depending on whether you already already have FSM installed or are deploying tracing and Jaeger during FSM installation. In either case, the following tracing values in values.yaml are being updated to point to your Jaeger instance:
enable: set totrueto tell the Pipy connection manager to send tracing data to a specific address (cluster)address: set to the destination cluster of your Jaeger instanceport: set to the destination port for the listener that you intend to useendpoint: set to the destination’s API or collector endpoint where the spans will be sent to
a) Enable tracing after FSM control plane has already been installed
If you already have FSM running, tracing values must be updated in the FSM MeshConfig using:
# Tracing configuration with sample values
kubectl patch meshconfig fsm-mesh-config -n fsm-system -p '{"spec":{"observability":{"tracing":{"enable":true,"address": "jaeger.fsm-system.svc.cluster.local","port":9411,"endpoint":"/api/v2/spans"}}}}'  --type=merge
You can verify these changes have been deployed by inspecting the fsm-mesh-config resource:
kubectl get meshconfig fsm-mesh-config -n fsm-system -o jsonpath='{.spec.observability.tracing}{"\n"}'
b) Enable tracing at FSM control plane install time
To deploy your own instance of Jaeger during FSM installation, you can use the --set flag as shown below to update the values:
fsm install --set fsm.tracing.enable=true,fsm.tracing.address=<tracing server hostname>,fsm.tracing.port=<tracing server port>,fsm.tracing.endpoint=<tracing server endpoint>
View the Jaeger UI with Port-Forwarding
Jaeger’s UI is running on port 16686. To view the web UI, you can use kubectl port-forward:
fsm_POD=$(kubectl get pods -n "$K8S_NAMESPACE" --no-headers  --selector app=jaeger | awk 'NR==1{print $1}')

kubectl port-forward -n "$K8S_NAMESPACE" "$fsm_POD"  16686:16686
Navigate to http://localhost:16686/ in a web browser to view the UI.
Example of Tracing with Jaeger
This section walks through the process of creating a simple Jaeger instance and enabling tracing with Jaeger in FSM.
Run the FSM Demo with Jaeger deployed. You have two options:
For automatic provisioning of Jaeger, simply set
DEPLOY_JAEGERin your.envfile to trueFor bring-your-own, you can deploy the sample instance provided by Jaeger using the commands below. If you wish to bring up Jaeger in a different namespace, make sure to update it below.
Create the Jaeger service.
kubectl apply -f - <<EOF
---
kind: Service
apiVersion: v1
metadata:
  name: jaeger
  namespace: fsm-system
  labels:
    app: jaeger
spec:
  selector:
    app: jaeger
  ports:
  - protocol: TCP
    # Service port and target port are the same
    port: 9411
  type: ClusterIP
EOF
Create the Jaeger deployment.
kubectl apply -f - <<EOF
---
apiVersion: apps/v1
kind: Deployment
metadata:
  name: jaeger
  namespace: fsm-system
  labels:
    app: jaeger
spec:
  replicas: 1
  selector:
    matchLabels:
      app: jaeger
  template:
    metadata:
      labels:
        app: jaeger
    spec:
      containers:
      - name: jaeger
        image: jaegertracing/all-in-one
        args:
          - --collector.zipkin.host-port=9411
        imagePullPolicy: IfNotPresent
        ports:
        - containerPort: 9411
        resources:
          limits:
            cpu: 500m
            memory: 512M
          requests:
            cpu: 100m
            memory: 256M
EOF
Enable tracing and pass in applicable values. If you have installed Jaeger in a different namespace, replace
fsm-systembelow.kubectl patch meshconfig fsm-mesh-config -n fsm-system -p '{"spec":{"observability":{"tracing":{"enable":true,"address": "jaeger.fsm-system.svc.cluster.local","port":9411,"endpoint":"/api/v2/spans"}}}}' --type=mergeRefer to instructions above to view the web UI using port forwarding
In the browser, you should see a
Servicedropdown which allows you to select from the various applications deployed by the bookstore demo.a) Select a service to view all spans from it. For example, if you select
bookbuyerwith aLookbackof one hour, you can see its interactions withbookstore-v1andbookstore-v2sorted by time.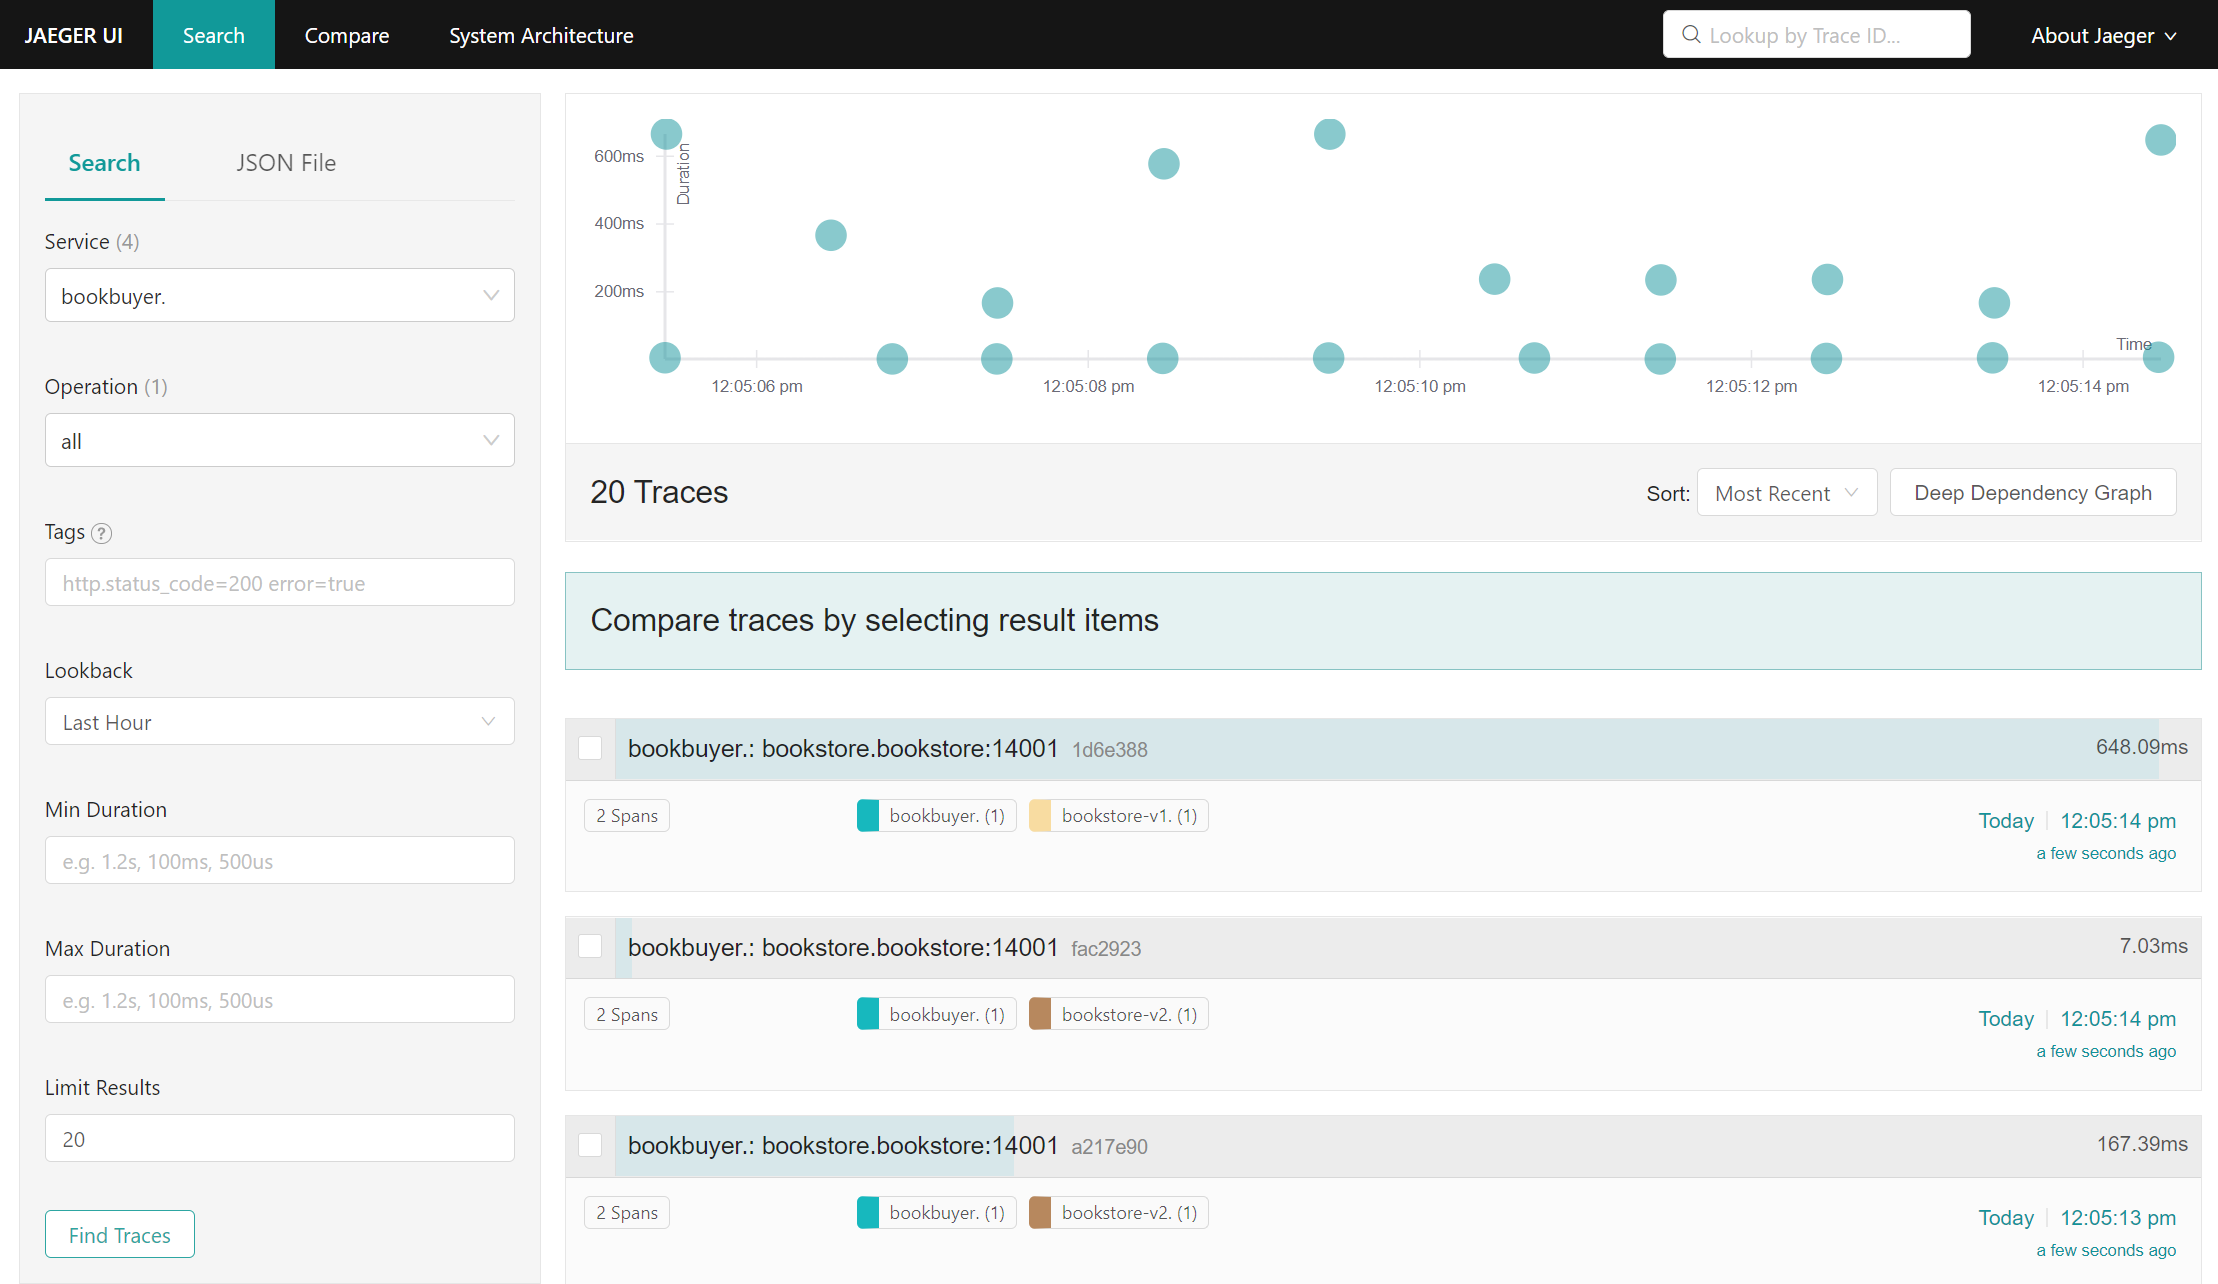
Jaeger UI search for bookbuyer traces b) Click on any item to view it in further detail
c) Select multiple items to compare traces. For example, you can compare the
bookbuyer’s interactions withbookstore-v1andbookstore-v2at a particular moment in time: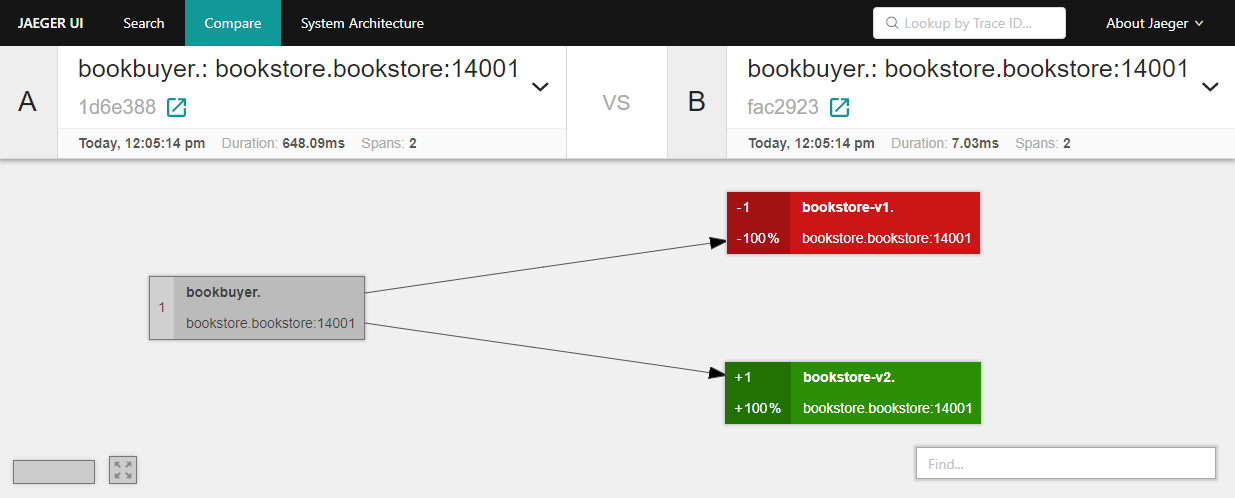
bookbuyer interactions with bookstore-v1 and bookestore-v2 d) Click on the
System Architecturetab to view a graph of how the various applications have been interacting/communicating. This provides an idea of how traffic is flowing between the applications.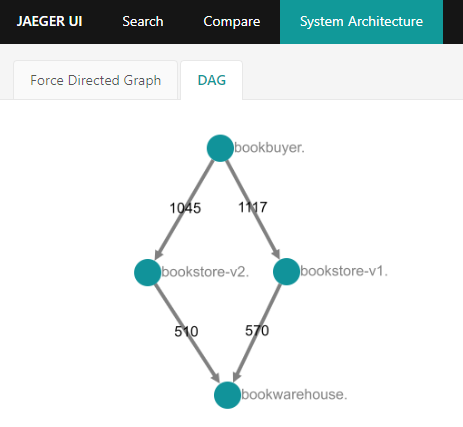
Directed acyclic graph of bookstore demo application interactions
If you are not seeing the bookstore demo applications in the Jaeger UI, tail the bookbuyer logs to ensure that the applications are successfully interacting.
POD="$(kubectl get pods -n "$BOOKBUYER_NAMESPACE" --show-labels --selector app=bookbuyer --no-headers | grep -v 'Terminating' | awk '{print $1}' | head -n1)"

kubectl logs "${POD}" -n "$BOOKBUYER_NAMESPACE" -c bookbuyer --tail=100 -f
Expect to see:
"MAESTRO! THIS TEST SUCCEEDED!"
This suggests that the issue is not caused by your Jaeger or tracing configuration.
Integrate Jaeger Tracing In Your Application
Jaeger tracing does not come effort-free. In order for Jaeger to connect requests to traces automatically, it is the application’s responsibility to publish the tracing information correctly.
In Open Service Mesh’s sidecar proxy configuration, currently Zipkin is used as the HTTP tracer. Therefore an application can leverage Zipkin supported headers to provide tracing information. In the initial request of a trace, the Zipkin plugin will generate the required HTTP headers. An application should propagate the headers below if it needs to add subsequent requests to the current trace:
x-request-idx-b3-traceidx-b3-spanidx-b3-parentspanid
Troubleshoot Tracing/Jaeger
When tracing is not working as expected.
1. Verify that tracing is enabled
Ensure the enable key in the tracing configuration is set to true:
kubectl get meshconfig fsm-mesh-config -n fsm-system -o jsonpath='{.spec.observability.tracing.enable}{"\n"}'
true
2. Verify the tracing values being set are as expected
If tracing is enabled, you can verify the specific address, port and endpoint being used for tracing in the fsm-mesh-config resource:
kubectl get meshconfig fsm-mesh-config -n fsm-system -o jsonpath='{.spec.observability.tracing}{"\n"}'
To verify that the Pipy point to the FQDN you intend to use, check the value for the address key.
3. Verify the tracing values being used are as expected
To dig one level deeper, you may also check whether the values set by the MeshConfig are being correctly used. Use the command below to get the config dump of the pod in question and save the output in a file.
fsm proxy get config_dump -n <pod-namespace> <pod-name> > <file-name>
Open the file in your favorite text editor and search for pipy-tracing-cluster. You should be able to see the tracing values in use. Example output for the bookbuyer pod:
"name": "pipy-tracing-cluster",
      "type": "LOGICAL_DNS",
      "connect_timeout": "1s",
      "alt_stat_name": "pipy-tracing-cluster",
      "load_assignment": {
       "cluster_name": "pipy-tracing-cluster",
       "endpoints": [
        {
         "lb_endpoints": [
          {
           "endpoint": {
            "address": {
             "socket_address": {
              "address": "jaeger.fsm-system.svc.cluster.local",
              "port_value": 9411
        [...]
4. Verify that the FSM Controller was installed with Jaeger automatically deployed [optional]
If you used automatic bring-up, you can additionally check for the Jaeger service and Jaeger deployment:
# Assuming FSM is installed in the fsm-system namespace:
kubectl get services -n fsm-system -l app=jaeger

NAME     TYPE        CLUSTER-IP   EXTERNAL-IP   PORT(S)    AGE
jaeger   ClusterIP   10.99.2.87   <none>        9411/TCP   27m
# Assuming FSM is installed in the fsm-system namespace:
kubectl get deployments -n fsm-system -l app=jaeger

NAME     READY   UP-TO-DATE   AVAILABLE   AGE
jaeger   1/1     1            1           27m
5. Verify Jaeger pod readiness, responsiveness and health
Check if the Jaeger pod is running in the namespace you have deployed it in:
The commands below are specific to FSM’s automatic deployment of Jaeger; substitute namespace and label values for your own tracing instance as applicable:
kubectl get pods -n fsm-system -l app=jaeger

NAME                     READY   STATUS    RESTARTS   AGE
jaeger-8ddcc47d9-q7tgg   1/1     Running   5          27m
To get information about the Jaeger instance, use kubectl describe pod and check the Events in the output.
kubectl describe pod -n fsm-system -l app=jaeger
External Resources
3 - Logs
FSM control plane components log diagnostic messages to stdout to aid in managing a mesh.
In the logs, users can expect to see the following kinds of information alongside messages:
- Kubernetes resource metadata, like names and namespaces
- mTLS certificate common names
FSM will not log sensitive information, such as:
- Kubernetes Secret data
- entire Kubernetes resources
Verbosity
Log verbosity controls when certain log messages are written, for example to include more messages for debugging or to include fewer messages that only point to critical errors.
FSM defines the following log levels in order of increasing verbosity:
| Log level | Purpose |
|---|---|
| disabled | Disables logging entirely |
| panic | Currently unused |
| fatal | For unrecoverable errors resulting in termination, usually on startup |
| error | For errors that may require user action to resolve |
| warn | For recovered errors or unexpected conditions that may lead to errors |
| info | For messages indicating normal behavior, such as acknowledging some user action |
| debug | For extra information useful in figuring out why a mesh may not be working as expected |
| trace | For extra verbose messages, used primarily for development |
Each of the above log levels can be configured in the MeshConfig at
spec.observability.fsmLogLevel or on install with the
fsm.controllerLogLevel chart value.
Fluent Bit
When enabled, Fluent Bit can collect these logs, process them and send them to an output of the user’s choice such as Elasticsearch, Azure Log Analytics, BigQuery, etc.
Fluent Bit is an open source log processor and forwarder which allows you to collect data/logs and send them to multiple destinations. It can be used with FSM to forward FSM controller logs to a variety of outputs/log consumers by using its output plugins.
FSM provides log forwarding by optionally deploying a Fluent Bit sidecar to the FSM controller using the --set=fsm.enableFluentbit=true flag during installation. The user can then define where FSM logs should be forwarded using any of the available Fluent Bit output plugins.
Configuring Log Forwarding with Fluent Bit
By default, the Fluent Bit sidecar is configured to simply send logs to the Fluent Bit container’s stdout. If you have installed FSM with Fluent Bit enabled, you may access these logs using kubectl logs -n <fsm-namespace> <fsm-controller-name> -c fluentbit-logger. This command will also help you find how your logs are formatted in case you need to change your parsers and filters.
Note:
<fsm-namespace>refers to the namespace where the fsm control plane is installed.
To quickly bring up Fluent Bit with default values, use the --set=fsm.enableFluentbit option:
fsm install --set=fsm.enableFluentbit=true
By default, logs will be filtered to emit info level logs. You may change the log level to “debug”, “warn”, “fatal”, “panic”, “disabled” or “trace” during installation using --set fsm.controllerLogLevel=<desired log level> . To get all logs, set the log level to trace.
Once you have tried out this basic setup, we recommend configuring log forwarding to your preferred output for more informative results.
To customize log forwarding to your output, follow these steps and then reinstall FSM with Fluent Bit enabled.
Find the output plugin you would like to forward your logs to in Fluent Bit documentation. Replace the
[OUTPUT]section influentbit-configmap.yamlwith appropriate values.The default configuration uses CRI log format parsing. If you are using a kubernetes distribution that causes your logs to be formatted differently, you may need to add a new parser to the
[PARSER]section and change theparsername in the[INPUT]section to one of the parsers defined here.Explore available Fluent Bit Filters and add as many
[FILTER]sections as desired.- The
[INPUT]section tags ingested logs withkube.*so make sure to includeMatch kube.*key/value pair in each of your custom filters. - The default configuration uses a modify filter to add a
controller_pod_namekey/value pair to help you query logs in your output by refining results on pod name (see example usage below).
- The
For these changes to take effect, run:
make build-fsmOnce you have updated the Fluent Bit ConfigMap template, you can deploy Fluent Bit during FSM installation using:
fsm install --set=fsm.enableFluentbit=true [--set fsm.controllerLogLevel=<desired log level>]You should now be able to interact with error logs in the output of your choice as they get generated.
Example: Using Fluent Bit to send logs to Azure Monitor
Fluent Bit has an Azure output plugin that can be used to send logs to an Azure Log Analytics workspace as follows:
Navigate to your new workspace in Azure Portal. Find your Workspace ID and Primary key in your workspace under Agents management. In
values.yaml, underfluentBit, update theoutputPlugintoazureand keysworkspaceIdandprimaryKeywith the corresponding values from Azure Portal (without quotes). Alternatively, you may replace entire output section influentbit-configmap.yamlas you would for any other output plugin.Run through steps 2-5 above.
Once you run FSM with Fluent Bit enabled, logs will populate under the Logs > Custom Logs section in your Log Analytics workspace. There, you may run the following query to view most recent logs first:
fluentbit_CL
| order by TimeGenerated desc
Refine your log results on a specific deployment of the FSM controller pod:
| where controller_pod_name_s == "<desired fsm controller pod name>"
Once logs have been sent to Log Analytics, they can also be consumed by Application Insights as follows:
Navigate to your instance in Azure Portal. Go to the Logs section. Run this query to ensure that logs are being picked up from Log Analytics:
workspace("<your-log-analytics-workspace-name>").fluentbit_CL
You can now interact with your logs in either of these instances.
Note: Fluent Bit is not currently supported on OpenShift.
Configuring Outbound Proxy Support for Fluent Bit
You may require outbound proxy support if your egress traffic is configured to go through a proxy server. There are two ways to enable this.
If you have already built FSM with the MeshConfig changes above, you can simply enable proxy support using the FSM CLI, replacing your values in the command below:
fsm install --set=fsm.enableFluentbit=true,fsm.fluentBit.enableProxySupport=true,fsm.fluentBit.httpProxy=<http-proxy-host:port>,fsm.fluentBit.httpsProxy=<https-proxy-host:port>
Alternatively, you may change the values in the Helm chart by updating the following in values.yaml:
Change
enableProxySupporttotrueUpdate the httpProxy and httpsProxy values to
"http://<host>:<port>". If your proxy server requires basic authentication, you may include its username and password as:http://<username>:<password>@<host>:<port>For these changes to take effect, run:
make build-fsmInstall FSM with Fluent Bit enabled:
fsm install --set=fsm.enableFluentbit=true
NOTE: Ensure that the Fluent Bit image tag is
1.6.4or greater as it is required for this feature.