This is the multi-page printable view of this section. Click here to print.
How-to Guides
- 1: Operating guides
- 1.1: Install the FSM CLI
- 1.2: Install the FSM Control Plane
- 1.3: Upgrade the FSM Control Plane
- 1.4: Uninstall the FSM Control Plane and Components
- 1.5: Mesh configuration
- 1.6: Reconciler Guide
- 1.7: Extending FSM
- 2: Application onboarding
- 2.1: Prerequisites
- 2.2: Namespace addition
- 2.3: Sidecar Injection
- 2.4: Application Protocol Selection
- 3: Traffic Management
- 3.1: Permissive Mode
- 3.2: Traffic Redirection
- 3.2.1: Iptables Redirection
- 3.2.2: eBPF Redirection
- 3.3: Traffic Splitting
- 3.4: Circuit Breaking
- 3.5: Retry
- 3.6: Rate Limiting
- 3.7: Ingress
- 3.7.1: Ingress to Mesh
- 3.7.2: Service Loadbalancer
- 3.7.3: FSM Ingress Controller
- 3.7.3.1: Installation
- 3.7.3.2: Basics
- 3.7.3.3: Advanced TLS
- 3.7.3.4: TLS Passthrough
- 3.7.4: FSM Gateway
- 3.7.4.1: Installation
- 3.7.4.2: HTTP Routing
- 3.7.4.3: HTTP URL Rewrite
- 3.7.4.4: HTTP Redirect
- 3.7.4.5: HTTP Request Header Manipulate
- 3.7.4.6: HTTP Response Header Manipulate
- 3.7.4.7: TCP Routing
- 3.7.4.8: TLS Termination
- 3.7.4.9: TLS Passthrough
- 3.7.4.10: gRPC Routing
- 3.7.4.11: UDP Routing
- 3.7.4.12: Fault Injection
- 3.7.4.13: Access Control
- 3.7.4.14: Rate Limit
- 3.7.4.15: Retry
- 3.7.4.16: Session Sticky
- 3.7.4.17: Health Check
- 3.7.4.18: Loadbalancing Algorithm
- 3.7.4.19: Upstream TLS
- 3.7.4.20: Gateway mTLS
- 3.7.4.21: Traffic Mirroring
- 3.8: Egress
- 3.8.1: Egress
- 3.8.2: Egress Gateway
- 3.9: Multi-cluster services
- 4: Observability
- 5: Health Checks
- 6: Integrations
- 6.1: Integrate Dapr with FSM
- 6.2: Integrate Prometheus with FSM
- 6.3: Microservice Discovery Integration
- 7: Security
- 7.1: Bi-directional mTLS
- 7.2: Access Control Management
- 7.3: Certificate Management
- 7.4: Traffic Access Control
- 8: Troubleshooting
- 8.1: Application Container Lifecycle
- 8.2: Error Codes
- 8.3: Prometheus
- 8.4: Grafana
- 8.5: Uninstall
- 8.6: Traffic Troubleshooting
- 8.6.1: Iptables Redirection
- 8.6.2: Permissive Traffic Policy Mode
- 8.6.3: Ingress
- 8.6.4: Egress Troubleshooting
- 9: Data plane benchmark
1 - Operating guides
1.1 - Install the FSM CLI
fsm CLI.Prerequisites
- Kubernetes cluster running Kubernetes v1.19.0 or greater
Set up the FSM CLI
From the Binary Releases
Download platform specific compressed package from the Releases page.
Unpack the fsm binary and add it to $PATH to get started.
Linux and macOS
In a bash-based shell on Linux/macOS or Windows Subsystem for Linux, use curl to download the FSM release and then extract with tar as follows:
# Specify the FSM version that will be leveraged throughout these instructions
FSM_VERSION=v1.3.3

# Linux curl command only
curl -sL "https://github.com/flomesh-io/fsm/releases/download/$FSM_VERSION/fsm-$FSM_VERSION-linux-amd64.tar.gz" | tar -vxzf -

# macOS curl command only
curl -sL "https://github.com/flomesh-io/fsm/releases/download/$FSM_VERSION/fsm-$FSM_VERSION-darwin-amd64.tar.gz" | tar -vxzf -
The fsm client binary runs on your client machine and allows you to manage FSM in your Kubernetes cluster. Use the following commands to install the FSM fsm client binary in a bash-based shell on Linux or Windows Subsystem for Linux. These commands copy the fsm client binary to the standard user program location in your PATH.
sudo mv ./linux-amd64/fsm /usr/local/bin/fsm
For macOS use the following commands:
sudo mv ./darwin-amd64/fsm /usr/local/bin/fsm
You can verify the fsm client library has been correctly added to your path and its version number with the following command.
fsm version
From Source (Linux, MacOS)
Building FSM from source requires more steps but is the best way to test the latest changes and useful in a development environment.
You must have a working Go environment and Helm 3 installed.
git clone https://github.com/flomesh-io/fsm.git
cd fsm
make build-fsm
make build-fsm will fetch any required dependencies, compile fsm and place it in bin/fsm. Add bin/fsm to $PATH so you can easily use fsm.
Install FSM
FSM Configuration
By default, the control plane components are installed into a Kubernetes Namespace called fsm-system and the control plane is given a unique identifier attribute mesh-name defaulted to fsm.
During installation, the Namespace and mesh-name can be configured through flags when using the fsm CLI or by editing the values file when using the helm CLI.
The mesh-name is a unique identifier assigned to an fsm-controller instance during install to identify and manage a mesh instance.
The mesh-name should follow RFC 1123 DNS Label constraints. The mesh-name must:
- contain at most 63 characters
- contain only lowercase alphanumeric characters or ‘-’
- start with an alphanumeric character
- end with an alphanumeric character
Using the FSM CLI
Use the fsm CLI to install the FSM control plane on to a Kubernetes cluster.
Run fsm install.
# Install fsm control plane components
fsm install
fsm-preinstall[fsm-preinstall-4vb8n] Done
fsm-bootstrap[fsm-bootstrap-cdbccf694-nwm74] Done
fsm-injector[fsm-injector-7c9f5f9cdf-tw99v] Done
fsm-controller[fsm-controller-6d5984fb9f-2nj7s] Done
FSM installed successfully in namespace [fsm-system] with mesh name [fsm]
Run fsm install --help for more options.
1.2 - Install the FSM Control Plane
Prerequisites
- Kubernetes cluster running Kubernetes v1.19.0 or greater
- The FSM CLI or the helm 3 CLI or the OpenShift
ocCLI.
Kubernetes support
FSM can be run on Kubernetes versions that are supported at the time of the FSM release. The current support matrix is:
| FSM | Kubernetes |
|---|---|
| 1.1 | 1.19 - 1.24 |
Using the FSM CLI
Use the fsm CLI to install the FSM control plane on to a Kubernetes cluster.
FSM CLI and Chart Compatibility
Each version of the FSM CLI is designed to work only with the matching version of the FSM Helm chart. Many operations may still work when some version skew exists, but those scenarios are not tested and issues that arise when using different CLI and chart versions may not get fixed even if reported.
Running the CLI
Run fsm install to install the FSM control plane.
fsm install
fsm-preinstall[fsm-preinstall-xsmz4] Done
fsm-bootstrap[fsm-bootstrap-7f59b7bf7-rs55z] Done
fsm-injector[fsm-injector-787bc867db-54gl6] Done
fsm-controller[fsm-controller-58d758b7fb-2zrr8] Done
FSM installed successfully in namespace [fsm-system] with mesh name [fsm]
Run fsm install --help for more options.
Note: Installing FSM via the CLI enforces deploying only one mesh in the cluster. FSM installs and manages the CRDs by adding a conversion webhook field to all the CRDs to support multiple API versions, which ties the CRDs to a specific instance of FSM. Hence, for FSM’s correct operation it is strongly recommended to have only one FSM mesh per cluster.
Using the Helm CLI
The FSM chart can be installed directly via the Helm CLI.
Editing the Values File
You can configure the FSM installation by overriding the values file.
Create a copy of the values file (make sure to use the version for the chart you wish to install).
Change any values you wish to customize. You can omit all other values.
To see which values correspond to the MeshConfig settings, see the FSM MeshConfig documentation
For example, to set the
logLevelfield in the MeshConfig toinfo, save the following asoverride.yaml:fsm: sidecarLogLevel: info
Helm install
Then run the following helm install command. The chart version can be found in the Helm chart you wish to install here.
helm install <mesh name> fsm --repo https://flomesh-io.github.io/fsm --version <chart version> --namespace <fsm namespace> --create-namespace --values override.yaml
Omit the --values flag if you prefer to use the default settings.
Run helm install --help for more options.
OpenShift
To install FSM on OpenShift:
Enable privileged init containers so that they can properly program iptables. The NET_ADMIN capability is not sufficient on OpenShift.
fsm install --set="fsm.enablePrivilegedInitContainer=true"- If you have already installed FSM without enabling privileged init containers, set
enablePrivilegedInitContainertotruein the FSM MeshConfig and restart any pods in the mesh.
- If you have already installed FSM without enabling privileged init containers, set
Add the
privilegedsecurity context constraint to each service account in the mesh.Install the oc CLI.
Add the security context constraint to the service account
oc adm policy add-scc-to-user privileged -z <service account name> -n <service account namespace>
Pod Security Policy
Deprecated: PSP support has been deprecated in FSM since v0.10.0
PSP support will be removed in FSM 1.0.0
If you are running FSM in a cluster with PSPs enabled, pass in --set fsm.pspEnabled=true to your fsm install or helm install CLI command.
Enable Reconciler in FSM
If you wish to enable a reconciler in FSM, pass in --set fsm.enableReconciler=true to your fsm install or helm install CLI command. More information on the reconciler can be found in the Reconciler Guide.
Inspect FSM Components
A few components will be installed by default. Inspect them by using the following kubectl command:
# Replace fsm-system with the namespace where FSM is installed
kubectl get pods,svc,secrets,meshconfigs,serviceaccount --namespace fsm-system
A few cluster wide (non Namespaced components) will also be installed. Inspect them using the following kubectl command:
kubectl get clusterrolebinding,clusterrole,mutatingwebhookconfiguration,validatingwebhookconfigurations -l app.kubernetes.io/name=flomesh.io
Under the hood, fsm is using Helm libraries to create a Helm release object in the control plane Namespace. The Helm release name is the mesh-name. The helm CLI can also be used to inspect Kubernetes manifests installed in more detail. Goto https://helm.sh for instructions to install Helm.
# Replace fsm-system with the namespace where FSM is installed
helm get manifest fsm --namespace fsm-system
Next Steps
Now that the FSM control plane is up and running, add services to the mesh.
1.3 - Upgrade the FSM Control Plane
This guide describes how to upgrade the FSM control plane.
How upgrades work
FSM’s control plane lifecycle is managed by Helm and can be upgraded with Helm’s upgrade functionality, which will patch or replace control plane components as needed based on changed values and resource templates.
Resource availability during upgrade
Since upgrades may include redeploying the fsm-controller with the new version, there may be some downtime of the controller. While the fsm-controller is unavailable, there will be a delay in processing new SMI resources, creating new pods to be injected with a proxy sidecar container will fail, and mTLS certificates will not be rotated.
Already existing SMI resources will be unaffected, this means that the data plane (which includes the Pipy sidecar configs) will also be unaffected by upgrading.
Data plane interruptions are expected if the upgrade includes CRD changes. Streamlining data plane upgrades is being tracked in issue #512.
Policy
Only certain upgrade paths are tested and supported.
Note: These plans are tentative and subject to change.
Breaking changes in this section refer to incompatible changes to the following user-facing components:
fsmCLI commands, flags, and behavior- SMI CRDs and controllers
This implies the following are NOT user-facing and incompatible changes are NOT considered “breaking” as long as the incompatibility is handled by user-facing components:
- Chart values.yaml
fsm-mesh-configMeshConfig- Internally-used labels and annotations (monitored-by, injection, metrics, etc.)
Upgrades are only supported between versions that do not include breaking changes, as described below.
For FSM versions 0.y.z:
- Breaking changes will not be introduced between
0.y.zand0.y.z+1 - Breaking changes may be introduced between
0.y.zand0.y+1.0
For FSM versions x.y.z where x >= 1:
- Breaking changes will not be introduced between
x.y.zandx.y+1.0or betweenx.y.zandx.y.z+1 - Breaking changes may be introduced between
x.y.zandx+1.0.0
How to upgrade FSM
The recommended way to upgrade a mesh is with the fsm CLI. For advanced use cases, helm may be used.
CRD Upgrades
Because Helm does not manage CRDs beyond the initial installation, FSM leverages an init-container on the fsm-bootstrap pod to to update existing and add new CRDs during an upgrade. If the new release contains updates to existing CRDs or adds new CRDs, the init-fsm-bootstrap on the fsm-bootstrap pod will update the CRDs. The associated Custom Resources will remain as is, requiring no additional action prior to or immediately after the upgrade.
Please check the CRD Updates section of the release notes to see if any updates have been made to the CRDs used by FSM. If the version of the Custom Resources are within the versions the updated CRD supports, no immediate action is required. FSM implements a conversion webhook for all of its CRDs, ensuring support for older versions and providing the flexibilty to update Custom Resources at a later point in time.
Upgrading with the FSM CLI
Pre-requisites
- Kubernetes cluster with the FSM control plane installed
- Ensure that the Kubernetes cluster has the minimum Kubernetes version required by the new FSM chart. This can be found in the Installation Pre-requisites
fsmCLI installed- By default, the
fsmCLI will upgrade to the same chart version that it installs. e.g. v0.9.2 of thefsmCLI will upgrade to v0.9.2 of the FSM Helm chart. Upgrading to any other version of the Helm chart than the version matching the CLI may work, but those scenarios are not tested and issues that arise may not get fixed even if reported.
- By default, the
The fsm mesh upgrade command performs a helm upgrade of the existing Helm release for a mesh.
Basic usage requires no additional arguments or flags:
fsm mesh upgrade
FSM successfully upgraded mesh fsm
This command will upgrade the mesh with the default mesh name in the default FSM namespace. Values from the previous release will NOT carry over to the new release by default, but may be passed individually with the --set flag on fsm mesh upgrade.
See fsm mesh upgrade --help for more details
Upgrading with Helm
Pre-requisites
- Kubernetes cluster with the FSM control plane installed
- The helm 3 CLI
FSM Configuration
When upgrading, any custom settings used to install or run FSM may be reverted to the default, this only includes any metrics deployments. Please ensure that you carefully follow the guide to prevent these values from being overwritten.
To preserve any changes you’ve made to the FSM configuration, use the helm --values flag. Create a copy of the values file (make sure to use the version for the upgraded chart) and change any values you wish to customize. You can omit all other values.
**Note: Any configuration changes that go into the MeshConfig will not be applied during upgrade and the values will remain as is prior to the upgrade. If you wish to update any value in the MeshConfig you can do so by patching the resource after an upgrade.
For example, if the logLevel field in the MeshConfig was set to info prior to upgrade, updating this in override.yaml will during an upgrade will not cause any change.
Warning: Do NOT change fsm.meshName or fsm.fsmNamespace
Helm Upgrade
Then run the following helm upgrade command.
helm upgrade <mesh name> fsm --repo https://flomesh-io.github.io/fsm --version <chart version> --namespace <fsm namespace> --values override.yaml
Omit the --values flag if you prefer to use the default settings.
Run helm upgrade --help for more options.
Upgrading Third Party Dependencies
Pipy
Pipy versions can be updated by modifying the value of the sidecarImage variable in fsm-mesh-config. For example, to update Pipy image to latest (this is for example only, the latest image is not recommended), the next command should be run.
export fsm_namespace=fsm-system # Replace fsm-system with the namespace where FSM is installed
kubectl patch meshconfig fsm-mesh-config -n $fsm_namespace -p '{"spec":{"sidecar":{"sidecarImage": "flomesh/pipy:latest"}}}' --type=merge
After the MeshConfig resource has been updated, all Pods and deployments that are part of the mesh must be restarted so that the updated version of the Pipy sidecar can be injected onto the Pod as part of the automated sidecar injection performed by FSM. This can be done with the kubectl rollout restart deploy command.
Prometheus, Grafana, and Jaeger
If enabled, FSM’s Prometheus, Grafana, and Jaeger services are deployed alongside other FSM control plane components. Though these third party dependencies cannot be updated through the meshconfig like Pipy, the versions can still be updated in the deployment directly. For instance, to update prometheus to v2.19.1, the user can run:
export fsm_namespace=fsm-system # Replace fsm-system with the namespace where FSM is installed
kubectl set image deployment/fsm-prometheus -n $fsm_namespace prometheus="prom/prometheus:v2.19.1"
To update to Grafana 8.1.0, the command would look like:
kubectl set image deployment/fsm-grafana -n $fsm_namespace grafana="grafana/grafana:8.1.0"
And for Jaeger, the user would run the following to update to 1.26.0:
kubectl set image deployment/jaeger -n $fsm_namespace jaeger="jaegertracing/all-in-one:1.26.0"
FSM Upgrade Troubleshooting Guide
FSM Mesh Upgrade Timing Out
Insufficient CPU
If the fsm mesh upgrade command is timing out, it could be due to insufficient CPU.
- Check the pods to see if any of them aren’t fully up and running
# Replace fsm-system with fsm-controller's namespace if using a non-default namespace
kubectl get pods -n fsm-system
- If there are any pods that are in Pending state, use
kubectl describeto check theEventssection
# Replace fsm-system with fsm-controller's namespace if using a non-default namespace
kubectl describe pod <pod-name> -n fsm-system
If you see the following error, then please increase the number of CPUs Docker can use.
`Warning FailedScheduling 4s (x15 over 19m) default-scheduler 0/1 nodes are available: 1 Insufficient cpu.`
Error Validating CLI Parameters
If the fsm mesh upgrade command is still timing out, it could be due to a CLI/Image Version mismatch.
- Check the pods to see if any of them aren’t fully up and running
# Replace fsm-system with fsm-controller's namespace if using a non-default namespace
kubectl get pods -n fsm-system
- If there are any pods that are in Pending state, use
kubectl describeto check theEventssection forError Validating CLI parameters
# Replace fsm-system with fsm-controller's namespace if using a non-default namespace
kubectl describe pod <pod-name> -n fsm-system
- If you find the error, please check the pod’s logs for any errors
kubectl logs -n fsm-system <pod-name> | grep -i error
If you see the following error, then it’s due to a CLI/Image Version mismatch.
`"error":"Please specify the init container image using --init-container-image","reason":"FatalInvalidCLIParameters"`
Workaround is to set the container-registry and fsm-image-tag flag when running fsm mesh upgrade.
fsm mesh upgrade --container-registry $CTR_REGISTRY --fsm-image-tag $CTR_TAG --enable-egress=true
Other Issues
If you’re running into issues that are not resolved with the steps above, please open a GitHub issue.
1.4 - Uninstall the FSM Control Plane and Components
This guide describes how to uninstall FSM from a Kubernetes cluster. This guide assumes there is a single FSM control plane (mesh) running. If there are multiple meshes in a cluster, repeat the process described for each control plane in the cluster before uninstalling any cluster wide resources at the end of the guide. Taking into consideration both the control plane and dataplane, this guide aims to walk through uninstalling all remnants of FSM with minimal downtime.
Prerequisites
- Kubernetes cluster with FSM installed
- The
kubectlCLI - The
FSMCLI or the Helm 3 CLI
Remove Pipy Sidecars from Application Pods and Pipy Secrets
The first step to uninstalling FSM is to remove the Pipy sidecar containers from application pods. The sidecar containers enforce traffic policies. Without them, traffic will flow to and from Pods according in accordance with default Kubernetes networking unless there are Kubernetes Network Policies applied.
FSM Pipy sidecars and related secrets will be removed in the following steps:
Disable Automatic Sidecar Injection
FSM Automatic Sidecar Injection is most commonly enabled by adding namespaces to the mesh via the fsm CLI. Use the fsm CLI to see which
namespaces have sidecar injection enabled. If there are multiple control planes installed, be sure to specify the --mesh-name flag.
View namespaces in a mesh:
fsm namespace list --mesh-name=<mesh-name>
NAMESPACE          MESH           SIDECAR-INJECTION
<namespace1>       <mesh-name>    enabled
<namespace2>       <mesh-name>    enabled
Remove each namespace from the mesh:
fsm namespace remove <namespace> --mesh-name=<mesh-name>
Namespace [<namespace>] successfully removed from mesh [<mesh-name>]
This will remove the flomesh.io/sidecar-injection: enabled annotation and flomesh.io/monitored-by: <mesh name> label from the namespace.
Alternatively, if sidecar injection is enabled via annotations on pods instead of per namespace, please modify the pod or deployment spec to remove the sidecar injection annotation.
Restart Pods
Restart all pods running with a sidecar:
# If pods are running as part of a Kubernetes deployment
# Can use this strategy for daemonset as well
kubectl rollout restart deployment <deployment-name> -n <namespace>

# If pod is running standalone (not part of a deployment or replica set)
kubectl delete pod <pod-name> -n namespace
k apply -f <pod-spec> # if pod is not restarted as part of replicaset
Now, there should be no FSM Pipy sidecar containers running as part of the applications that were once part of the mesh. Traffic is no
longer managed by the FSM control plane with the mesh-name used above. During this process, your applications may experience some downtime
as all the Pods are restarting.
Uninstall FSM Control Plane and Remove User Provided Resources
The FSM control plane and related components will be uninstalled in the following steps:
- Prerequisites
- Remove Pipy Sidecars from Application Pods and Pipy Secrets
- Uninstall FSM Control Plane and Remove User Provided Resources
Uninstall the FSM control plane
Use the fsm CLI to uninstall the FSM control plane from a Kubernetes cluster. The following step will remove:
- FSM controller resources (deployment, service, mesh config, and RBAC)
- Prometheus, Grafana, Jaeger, and Fluent Bit resources installed by FSM
- Mutating webhook and validating webhook
- The conversion webhook fields patched by FSM to the CRDs installed/required by FSM: CRDs for FSM will be unpatched. To delete cluster wide resources refer to Removal of FSM Cluster Wide Resources for more details.
Run fsm uninstall mesh:
# Uninstall fsm control plane components
fsm uninstall mesh --mesh-name=<mesh-name>
Uninstall FSM [mesh name: <mesh-name>] ? [y/n]: y
FSM [mesh name: <mesh-name>] uninstalled
Run fsm uninstall mesh --help for more options.
Alternatively, if you used Helm to install the control plane, run the following helm uninstall command:
helm uninstall <mesh name> --namespace <fsm namespace>
Run helm uninstall --help for more options.
Remove User Provided Resources
If any resources were provided or created for FSM at install time, they can be deleted at this point.
For example, if Hashicorp Vault was deployed for the sole purpose of managing certificates for FSM, all related resources can be deleted.
Delete FSM Namespace
When installing a mesh, the fsm CLI creates the namespace the control plane is installed into if it does not already exist. However, when uninstalling the same mesh, the namespace it lives in does not automatically get deleted by the fsm CLI. This behavior occurs because
there may be resources a user created in the namespace that they may not want automatically deleted.
If the namespace was only used for FSM and there is nothing that needs to be kept around, the namespace can be deleted at the time of uninstall or later using the following command.
fsm uninstall mesh --delete-namespace
Warning: Only delete the namespace if resources in the namespace are no longer needed. For example, if fsm was installed in
kube-system, deleting the namespace may delete important cluster resources and may have unintended consequences.
Removal of FSM Cluster Wide Resources
On installation FSM ensures that all the CRDs mentioned here exist in the cluster at install time. During installation, if they are not already installed, the fsm-bootstrap pod will install them before the rest of the control plane components are running. This is the same behavior when using the Helm charts to install FSM as well.
Uninstalling the mesh in both unmanaged and managed environments:
- removes FSM control plane components, including control plane pods
- removes/un-patches the conversion webhook fields from all the CRDs (which FSM adds to support multiple CR versions)
leaving behind certain FSM resources to prevent unintended consequences for the cluster after uninstalling FSM.The resources that are left behind will depend on whether FSM was uninstalled from a managed or unmanaged cluster environment.
When uninstalling FSM, both the fsm uninstall mesh command and Helm uninstallation will not delete any FSM or SMI CRD in any cluster environment (managed and unmanaged) for primarily two reasons:
- CRDs are cluster-wide resources and may be used by other service meshes or resources running in the same cluster
- deletion of a CRD will cause all custom resources corresponding to that CRD to also be deleted
To remove cluster wide resources that FSM installs (i.e. the meshconfig, secrets, FSM CRDs, SMI CRDs, and webhook configurations), the following command can be run during or after FSM’s uninstillation.
fsm uninstall mesh --delete-cluster-wide-resources
Warning: Deletion of a CRD will cause all custom resources corresponding to that CRD to also be deleted.
To troubleshoot FSM uninstallation, refer to the uninstall troubleshooting section
1.5 - Mesh configuration
FSM deploys a MeshConfig resource fsm-mesh-config as a part of its control plane (in the same namespace as that of the fsm-controller pod) which can be updated by the mesh owner/operator at any time. The purpose of this MeshConfig is to provide the mesh owner/operator the ability to update some of the mesh configurations based on their needs.
At the time of install, the FSM MeshConfig is deployed from a preset MeshConfig (preset-mesh-config) which can be found under charts/fsm/templates.
First, set an environment variable to refer to the namespace where fsm was installed.
export FSM_NAMESPACE=fsm-system # Replace fsm-system with the namespace where FSM is installed
To view your fsm-mesh-config in CLI use the kubectl get command.
kubectl get meshconfig fsm-mesh-config -n "$FSM_NAMESPACE" -o yaml
Note: Values in the MeshConfig fsm-mesh-config are persisted across upgrades.
Configure FSM MeshConfig
Kubectl Patch Command
Changes to fsm-mesh-config can be made using the kubectl patch command.
kubectl patch meshconfig fsm-mesh-config -n "$FSM_NAMESPACE" -p '{"spec":{"traffic":{"enableEgress":true}}}' --type=merge
Refer to the Config API reference for more information.
If an incorrect value is used, validations on the MeshConfig CRD will prevent the change with an error message explaining why the value is invalid.
For example, the below command shows what happens if we patch enableEgress to a non-boolean value.
kubectl patch meshconfig fsm-mesh-config -n "$FSM_NAMESPACE" -p '{"spec":{"traffic":{"enableEgress":"no"}}}'  --type=merge
# Validations on the CRD will deny this change
The MeshConfig "fsm-mesh-config" is invalid: spec.traffic.enableEgress: Invalid value: "string": spec.traffic.enableEgress in body must be of type boolean: "string"
Kubectl Patch Command for Each Key Type
Note:
<fsm-namespace>refers to the namespace where the fsm control plane is installed. By default, the fsm namespace isfsm-system.
| Key | Type | Default Value | Kubectl Patch Command Examples |
|---|---|---|---|
| spec.traffic.enableEgress | bool | false | kubectl patch meshconfig fsm-mesh-config -n $FSM_NAMESPACE -p '{"spec":{"traffic":{"enableEgress":true}}}' --type=merge |
| spec.traffic.enablePermissiveTrafficPolicyMode | bool | false | kubectl patch meshconfig fsm-mesh-config -n $FSM_NAMESPACE -p '{"spec":{"traffic":{"enablePermissiveTrafficPolicyMode":true}}}' --type=merge |
| spec.traffic.useHTTPSIngress | bool | false | kubectl patch meshconfig fsm-mesh-config -n $FSM_NAMESPACE -p '{"spec":{"traffic":{"useHTTPSIngress":true}}}' --type=merge |
| spec.traffic.outboundPortExclusionList | array | [] | kubectl patch meshconfig fsm-mesh-config -n $FSM_NAMESPACE -p '{"spec":{"traffic":{"outboundPortExclusionList":6379,8080}}}' --type=merge |
| spec.traffic.outboundIPRangeExclusionList | array | [] | kubectl patch meshconfig fsm-mesh-config -n $FSM_NAMESPACE -p '{"spec":{"traffic":{"outboundIPRangeExclusionList":"10.0.0.0/32,1.1.1.1/24"}}}' --type=merge |
| spec.certificate.serviceCertValidityDuration | string | "24h" | kubectl patch meshconfig fsm-mesh-config -n $FSM_NAMESPACE -p '{"spec":{"certificate":{"serviceCertValidityDuration":"24h"}}}' --type=merge |
| spec.observability.enableDebugServer | bool | false | kubectl patch meshconfig fsm-mesh-config -n $FSM_NAMESPACE -p '{"spec":{"observability":{"serviceCertValidityDuration":true}}}' --type=merge |
| spec.observability.tracing.enable | bool | "jaeger.<fsm-namespace>.svc.cluster.local" | kubectl patch meshconfig fsm-mesh-config -n $FSM_NAMESPACE -p '{"spec":{"observability":{"tracing":{"address": "jaeger.<fsm-namespace>.svc.cluster.local"}}}}' --type=merge |
| spec.observability.tracing.address | string | "/api/v2/spans" | kubectl patch meshconfig fsm-mesh-config -n $FSM_NAMESPACE -p '{"spec":{"observability":{"tracing":{"endpoint":"/api/v2/spans"}}}}' --type=merge' --type=merge |
| spec.observability.tracing.endpoint | string | false | kubectl patch meshconfig fsm-mesh-config -n $FSM_NAMESPACE -p '{"spec":{"observability":{"tracing":{"enable":true}}}}' --type=merge |
| spec.observability.tracing.port | int | 9411 | kubectl patch meshconfig fsm-mesh-config -n $FSM_NAMESPACE -p '{"spec":{"observability":{"tracing":{"port":9411}}}}' --type=merge |
| spec.sidecar.enablePrivilegedInitContainer | bool | false | kubectl patch meshconfig fsm-mesh-config -n $FSM_NAMESPACE -p '{"spec":{"sidecar":{"enablePrivilegedInitContainer":true}}}' --type=merge |
| spec.sidecar.logLevel | string | "error" | kubectl patch meshconfig fsm-mesh-config -n $FSM_NAMESPACE -p '{"spec":{"sidecar":{"logLevel":"error"}}}' --type=merge |
| spec.sidecar.maxDataPlaneConnections | int | 0 | kubectl patch meshconfig fsm-mesh-config -n $FSM_NAMESPACE -p '{"spec":{"sidecar":{"maxDataPlaneConnections":"error"}}}' --type=merge |
| spec.sidecar.configResyncInterval | string | "0s" | kubectl patch meshconfig fsm-mesh-config -n $FSM_NAMESPACE -p '{"spec":{"sidecar":{"configResyncInterval":"30s"}}}' --type=merge |
1.6 - Reconciler Guide
This guide describes how to enable the reconciler in FSM.
How the reconciler works
The goal of building a reconciler in FSM is to ensure resources required for the correct operation of FSM’s control plane are in their desired state at all times. Resources that are installed as a part of FSM install and have the labels flomesh.io/reconcile: true and app.kubernetes.io/name: flomesh.io will be reconciled by the reconciler.
Note: The reconciler will not operate as desired if the lables flomesh.io/reconcile: true and app.kubernetes.io/name: flomesh.io are modified or deleted on the reconcilable resources.
An update or delete event on the reconcilable resources will trigger the reconciler and it will reconcile the resource back to its desired state. Only metadata changes (excluding a name change) will be permitted on the reconcilable resources.
Resources reconciled
The resources that FSM reconciles are:
- CRDs : The CRDs installed/required by FSM CRDs for FSM will be reconciled. Since FSM manages the installation and upgrade of the CRDs it needs, FSM will also reconcile them to ensure that their spec, stored and served verions are always in the state that is required by FSM.
- MutatingWebhookConfiguration : A MutatingWebhookConfiguration is deployed as a part of FSM’s control plane to enable automatic sidecar injection. As this is a very critical component for pods joining the mesh, FSM reconciles this resource.
- ValidatingWebhookConfiguration : A ValidatingWebhookConfiguration is deployed as a part of FSM’s control plane to validate various mesh configurations. This resources validates configurations being applied to the mesh, hence FSM will reconcile this resource.
How to install FSM with the reconciler
To install FSM with the reconciler, use the below command:
fsm install --set fsm.enableReconciler=true
fsm-preinstall[fsm-preinstall-zqmxm] Done
fsm-bootstrap[fsm-bootstrap-7f59b7bf7-vf96p] Done
fsm-injector[fsm-injector-787bc867db-m5wxk] Done
fsm-controller[fsm-controller-58d758b7fb-46v4k] Done
FSM installed successfully in namespace [fsm-system] with mesh name [fsm]
1.7 - Extending FSM
Extending FSM with Plugin Interface
In the latest 1.3.0 version of Flomesh service mesh FSM, we have introduced a significant feature: Plugin. This feature aims to provide developers with a way to extend the functionality of the service mesh without changing the FSM itself.
Nowadays, service mesh seems to be developing in two directions. One is like Istio, which provides a lot of ready-to-use functions and is very rich in features. The other like Linkerd, Flomesh FSM, and others that uphold the principle of simplicity and provide a minimum functional set that meets the user’s needs. There is no superiority or inferiority between the two: the former is rich in features but inevitably has the additional overhead of proxy, not only in resource consumption but also in the cost of learning and maintenance; the latter is easy to learn and use, consumes fewer resources, but the provided functions might not be enough for the immediate need of user desired functionality.
It is not difficult to imagine that the ideal solution is the low cost of the minimum functional set + the flexibility of scalability. The core of the service mesh is in the data plane, and the flexibility of scalability requires a high demand for the physique of the sidecar proxy. This is also why the Flomesh service mesh chose programmable proxy Pipy as the sidecar proxy.
Pipy is a programmable network proxy for cloud, edge, and IoT. It is flexible, fast, small, programmable, and open-source. The modular design of Pipy provides a large number of reusable filters that can be assembled into pipelines to process network data. Pipy provides a set of api and small usable filters to achieve business objectives while hiding the underlying details. Additionally, Pipy scripts (programming code that implements functional logic) can be dynamically delivered to Pipy instances over the network, enabling the proxy to be extended with new features without the need for compilation or restart.
Flomesh FSM extension solution
FSM provides three new CRDs for extensibility:
Plugin: The plugin contains the code logic for the new functionality. The default functions provided by FSM are also available as plugins, but not in the form of aPluginresource. These plugins can be adjusted through the Helm values file when installing FSM. For more information, refer to the built-in plugin list in the Helm values.yaml file.PluginChain: The plugin chain is the execution of plugins in sequence. The system provides four plugin chains:inbound-tcp,inbound-http,outbound-tcp,outbound-http. They correspond to the OSI layer-4 and layer-7 processing stages of inbound and outbound traffic, respectively.PluginConfig: The plugin configuration provides the configuration required for the plugin logic to run, which will be sent to the FSM sidecar proxy in JSON format.
For detailed information on plugin CRDs, refer to the Plugin API document.
Built-in variables
Below is a list of built-in PipyJS variables which can be imported into your custom plugins via PipyJS import keyword.
| variable | type | namespace | suited for Chains | description |
|---|---|---|---|---|
| __protocol | string | inbound | inbound-http / inbound-tcp | connection protocol indicator |
| __port | json | inbound | inbound-http / inbound-tcp | port of inbound endpoint |
| __isHTTP2 | boolean | inbound | inbound-http | whether protocol is HTTP/2 |
| __isIngress | boolean | inbound | inbound-http | Ingress mode enabled |
| __target | string | inbound/connect-tcp | inbound-http / inbound-tcp | Destination upstream |
| __plugins | json | inbound | inbound-http / inbound-tcp | JSON object of inbound plugins |
| __service | json | inbound-http-routing | inbound-http | http service json object |
| __route | json | inbound-http-routing | inbound-http | http route json object |
| __cluster | json | inbound-http-routing inbound-tcp-rouging | inbound-http inbound-tcp | target cluster json object |
| __protocol | string | outbound | outbound-http / outbound-tcp | outbound connection protocol |
| __port | json | outbound | outbound-http / outbound-tcp | outbound port json object |
| __isHTTP2 | boolean | outbound | outbound-http | whether protocol is HTTP/2 |
| __isEgress | boolean | outbound | outbound-tcp | Egress mode |
| __target | string | outbound/ | outbound-http / outbound-tcp | Upstream target |
| __plugins | json | outbound | outbound-http / outbound-tcp | outbound plugin json object |
| __service | json | outbound-http-routing | outbound-http | http service json object |
| __route | json | outbound-http-routing | outbound-http | http route json object |
| __cluster | json | outbound-http-routing outbound-tcp-routing | outbound-http outbound-tcp | target cluster json object |
Demo
For a simple demonstration of how to extend FSM via Plugins, refer to below demo:
2 - Application onboarding
The following guide describes how to onboard a Kubernetes microservice to an FSM instance.
Refer to the application requirements guide before onboarding applications.
Configure and Install Service Mesh Interface (SMI) policies
FSM conforms to the SMI specification. By default, FSM denies all traffic communications between Kubernetes services unless explicitly allowed by SMI policies. This behavior can be overridden with the
--set=fsm.enablePermissiveTrafficPolicy=trueflag on thefsm installcommand, allowing SMI policies not to be enforced while allowing traffic and services to still take advantage of features such as mTLS-encrypted traffic, metrics, and tracing.For example SMI policies, please see the following examples:
If an application in the mesh needs to communicate with the Kubernetes API server, the user needs to explicitly allow this either by using IP range exclusion or by creating an egress policy as outlined below.
First get the Kubernetes API server cluster IP:
$ kubectl get svc -n default
NAME         TYPE        CLUSTER-IP   EXTERNAL-IP   PORT(S)   AGE
kubernetes   ClusterIP   10.0.0.1     <none>        443/TCP   1d
Option 1: add the Kubernetes API server’s address to the list of Global outbound IP ranges for exclusion. The IP address could be a cluster IP address or a public IP address and should be appropriately excluded for connectivity to the Kubernetes API server.
Add this IP to the MeshConfig so that outbound traffic to it is excluded from interception by FSM’s sidecar:
$ kubectl patch meshconfig fsm-mesh-config -n <fsm-namespace> -p '{"spec":{"traffic":{"outboundIPRangeExclusionList":["10.0.0.1/32"]}}}'  --type=merge
meshconfig.config.flomesh.io/fsm-mesh-config patched
Restart the relevant pods in monitored namespaces for this change to take effect.
Option 2: apply an Egress policy to allow access to the Kubernetes API server over HTTPS
Note: when using an Egress policy, the Kubernetes API service must not be in a namespace that FSM manages
- Enable egress policy if not enabled:
kubectl patch meshconfig fsm-mesh-config -n <fsm-namespace> -p '{"spec":{"featureFlags":{"enableEgressPolicy":true}}}' --type=merge- Apply an Egress policy to allow the application’s ServiceAccount to access the Kubernetes API server cluster IP found above. For example:
kubectl apply -f - <<EOF
kind: Egress
apiVersion: policy.flomesh.io/v1alpha1
metadata:
    name: k8s-server-egress
    namespace: test
spec:
    sources:
    - kind: ServiceAccount
      name: <app pod's service account name>
      namespace: <app pod's service account namespace>
    ipAddresses:
    - 10.0.0.1/32
    ports:
    - number: 443
      protocol: https
EOF
Onboard Kubernetes Namespaces to FSM
To onboard a namespace containing applications to be managed by FSM, run the
fsm namespace addcommand:$ fsm namespace add <namespace> --mesh-name <mesh-name>By default, the
fsm namespace addcommand enables automatic sidecar injection for pods in the namespace.To disable automatic sidecar injection as a part of enrolling a namespace into the mesh, use
fsm namespace add <namespace> --disable-sidecar-injection. Once a namespace has been onboarded, pods can be enrolled in the mesh by configuring automatic sidecar injection. See the Sidecar Injection document for more details.Deploy new applications or redeploy existing applications
By default, new deployments in onboarded namespaces are enabled for automatic sidecar injection. This means that when a new Pod is created in a managed namespace, FSM will automatically inject the sidecar proxy to the Pod. Existing deployments need to be restarted so that FSM can automatically inject the sidecar proxy upon Pod re-creation. Pods managed by a Deployment can be restarted using the
kubectl rollout restart deploycommand.In order to route protocol specific traffic correctly to service ports, configure the application protocol to use. Refer to the application protocol selection guide to learn more.
Note: Removing Namespaces
Namespaces can be removed from the FSM mesh with the fsm namespace remove command:
fsm namespace remove <namespace>
Please Note: The
fsm namespace removecommand only tells FSM to stop applying updates to the sidecar proxy configurations in the namespace. It does not remove the proxy sidecars. This means the existing proxy configuration will continue to be used, but it will not be updated by the FSM control plane. If you wish to remove the proxies from all pods, remove the pods’ namespaces from the FSM mesh with the CLI and reinstall all the pod workloads.
2.1 - Prerequisites
Security Contexts
- Do not run applications with the user ID (UID) value of 1500. This is reserved for the Pipy proxy sidecar container injected into pods by FSM’s sidecar injector.
- If security context
runAsNonRootis set totrueat the pod level, arunAsUservalue must be provided either for the pod or for each container. For example:If the UID is omitted, application containers may attempt to run as root user by default, causing conflict with the pod’s security context.securityContext: runAsNonRoot: true runAsUser: 1200 - Additional capabilities are not required.
Note: the FSM init container is programmed to run as root and add capability
NET_ADMINas it requires these security contexts to finish scheduling. These values are not changed by application security contexts.
Ports
Do not use the following ports as they are used by the Pipy sidecar.
| Port | Description |
|---|---|
| 15000 | Pipy Admin Port |
| 15001 | Pipy Outbound Listener Port |
| 15003 | Pipy Inbound Listener Port |
| 15010 | Pipy Prometheus Inbound Listener Port |
2.2 - Namespace addition
Overview
When setting up an FSM control plane (also referred to as a “mesh”), one can also enroll a set of Kubernetes namespaces to the mesh. Enrolling a namespace to FSM allows FSM to monitor the resources within that Namespace whether they be applications deployed in Pods, Services, or even traffic policies represented as SMI resources.
Only one mesh can monitor a namespace, so this is something to watch out for when there are multiple instances of FSM within the same Kubernetes cluster. When applying policies to applications, FSM will only assess resources in either monitored namespaces so it is important to enroll namespaces where your applications are deployed to the correct instance of FSM with the correct mesh name. Enrolling a namespace also optionally allows for metrics to be collected for resources in the given namespace and for Pods in the namespace to be automatically injected with sidecar proxy containers. These are all features that help FSM provide functionality for traffic management and observability. Scoping this functionality at the namespace level allows teams to organize which segments of their cluster should be part of which mesh.
Namespace monitoring, automatic sidecar injection, and metrics collection is controlled by adding certain labels and annotations to a Kubernetes namespace. This can be done manually or using the fsm CLI although using the fsm CLI is the recommended approach. The presence of the label flomesh.io/monitored-by=<mesh-name> allows an FSM control plane with the given mesh-name to monitor
all resources within that namespace. The annotation flomesh.io/sidecar-injection=enabled enables FSM to automatically inject sidecar proxy containers in all Pods created within that namespace. The metrics annotation flomesh.io/metrics=enabled allows FSM to collect metrics on resources within a Namespace.
See how to use the FSM CLI to manage namespace monitoring below.
Adding a Namespace to the FSM Control Plane
Add a namespace for monitoring and sidecar injection to the mesh with the following command:
fsm namespace add <namespace>
Explicitly disable sidecar injection while adding the namespace using --disable-sidecar-injection flag as shown here.
Remove a Namespace from the FSM control plane
Remove a namespace from being monitored by the mesh and disable sidecar injection with the following command:
fsm namespace remove <namespace>
This command will remove the FSM specific labels and annotations on the namespace thus removing it from the mesh.
Enable Metrics for a Namespace
fsm metrics enable --namespace <namespace>
Ignore a Namespace
There may be namespaces in a cluster that should never be part of a mesh. To explicity exclude a namespace from FSM:
fsm namespace ignore <namespace>
List Namespaces Part of a Mesh
To list namespaces within a specific mesh:
fsm namespace list --mesh-name=<mesh-name>
Troubleshooting Guide
Policy Issues
If you’re not seeing changes in SMI policies being applied to resources in a namespace, ensure the namespace is enrolled in the correct mesh:
fsm namespace list --mesh-name=<mesh-name>

NAMESPACE         MESH   SIDECAR-INJECTION
<namespace>       fsm    enabled
If the namespace does not show up, check the labels on the namespace using kubectl:
kubectl get namespace <namespace> --show-labels

NAME          STATUS   AGE   LABELS
<namespace>   Active   36s   flomesh.io/monitored-by=<mesh-name>
If the label value is not the expected mesh-name, remove the namespace from the mesh and add it back using the correct mesh-name.
fsm namespace remove <namespace> --mesh-name=<current-mesh-name>
fsm namespace add <namespace> --mesh-name=<expected-mesh-name>
If the monitored-by label is not present, it was either not added to the mesh or there was an error when adding it to the mesh.
Add the namespace to the mesh either with the fsm CLI or using kubectl:
fsm namespace add <namespace> --mesh-name=<mesh-name>
kubectl label namespace <namespace> flomesh.io/monitored-by=<mesh-name>
Issues with Automatic Sidecar Injection
If you’re not seeing your Pods being automatically injected with sidecar containers, ensure that sidecar injection is enabled:
fsm namespace list --mesh-name=<mesh-name>

NAMESPACE         MESH   SIDECAR-INJECTION
<namespace>       fsm    enabled
If the namespace does not show up, check the annotations on the namespace using kubectl:
kubectl get namespace <namespace> -o=jsonpath='{.metadata.annotations.flomesh\.io\/sidecar-injection}'
If the output is anything other than enabled, either add namespace using the fsm CLI or add the annotation with kubectl:
fsm namespace add <namespace> --mesh-name=<mesh-name> --disable-sidecar-injection=false
kubectl annotate namespace <namespace> flomesh.io/sidecar-injection=enabled --overwrite
Issues with Metrics Collection
If you’re not seeing metrics for resources in a particular namespace, ensure metrics are enabled:
kubectl get namespace <namespace> -o=jsonpath='{.metadata.annotations.flomesh\.io\/metrics}'
If the output is anything other than enabled, enable the namespace usng the fsm CLI or add the annotation with kubectl:
fsm metrics enable --namespace <namespace>
kubectl annotate namespace <namespace> flomesh.io/metrics=enabled --overwrite
Other Issues
If you’re running into issues that have not been resolved with the debugging techniques above, please open a GitHub issue on the repository.
2.3 - Sidecar Injection
Services participating in the service mesh communicate via sidecar proxies installed on pods backing the services. The following sections describe the sidecar injection workflow in FSM.
Automatic Sidecar Injection
Automatic sidecar injection is currently the only way to inject sidecars into the service mesh. Sidecars can be automatically injected into applicable Kubernetes pods using a mutating webhook admission controller provided by FSM.
Automatic sidecar injection can be configured per namespace as a part of enrolling a namespace into the mesh, or later using the Kubernetes API. Automatic sidecar injection can be enabled either on a per namespace or per pod basis by annotating the namespace or pod resource with the sidecar injection annotation. Individual pods and namespaces can be explicitly configured to either enable or disable automatic sidecar injection, giving users the flexibility to control sidecar injection on pods and namespaces.
Enabling Automatic Sidecar Injection
Prerequisites:
- The namespace to which the pods belong must be a monitored namespace that is added to the mesh using the
fsm namespace addcommand. - The namespace to which the pods belong must not be set to be ignored using the
fsm namespace ignorecommand. - The namespace to which the pods belong must not have a label with key
nameand value corresponding to the FSM control plane namespace. For example, a namespace with a labelname: fsm-systemwherefsm-systemis the control plane namespace cannot have sidecar injection enabled for pods in this namespace. - The pod must not have
hostNetwork: truein the pod spec. Pods withhostNetwork: trueare not injected with a sidecar since doing so can result in routing failures in the host network.
Automatic Sidecar injection can be enabled in the following ways:
While enrolling a namespace into the mesh using
fsmcli:fsm namespace add <namespace>: Automatic sidecar injection is enabled by default with this command.Using
kubectlto annotate individual namespaces and pods to enable sidecar injection:# Enable sidecar injection on a namespace $ kubectl annotate namespace <namespace> flomesh.io/sidecar-injection=enabled# Enable sidecar injection on a pod $ kubectl annotate pod <pod> flomesh.io/sidecar-injection=enabledSetting the sidecar injection annotation to
enabledin the Kubernetes resource spec for a namespace or pod:metadata: name: test annotations: 'flomesh.io/sidecar-injection': 'enabled'Pods will be injected with a sidecar ONLY if the following conditions are met:
- The namespace to which the pod belongs is a monitored namespace.
- The pod is explicitly enabled for the sidecar injection, OR the namespace to which the pod belongs is enabled for the sidecar injection and the pod is not explicitly disabled for sidecar injection.
Explicitly Disabling Automatic Sidecar Injection on Namespaces
Namespaces can be disabled for automatic sidecar injection in the following ways:
While enrolling a namespace into the mesh using
fsmcli:fsm namespace add <namespace> --disable-sidecar-injection: If the namespace was previously enabled for sidecar injection, it will be disabled after running this command.Using
kubectlto annotate individual namespaces to disable sidecar injection:# Disable sidecar injection on a namespace $ kubectl annotate namespace <namespace> flomesh.io/sidecar-injection=disabled
Explicitly Disabling Automatic Sidecar Injection on Pods
Individual pods can be explicitly disabled for sidecar injection. This is useful when a namespace is enabled for sidecar injection but specific pods should not be injected with sidecars.
Using
kubectlto annotate individual pods to disable sidecar injection:# Disable sidecar injection on a pod $ kubectl annotate pod <pod> flomesh.io/sidecar-injection=disabledSetting the sidecar injection annotation to
disabledin the Kubernetes resource spec for the pod:metadata: name: test annotations: 'flomesh.io/sidecar-injection': 'disabled'
Automatic sidecar injection is implicitly disabled for a namespace when it is removed from the mesh using the fsm namespace remove command.
2.4 - Application Protocol Selection
FSM is capable of routing different application protocols such as HTTP, TCP, and gRPC differently. The following guide describes how to configure service ports to specify the application protocol to use for traffic filtering and routing.
Configuring the application protocol
Kubernetes services expose one or more ports. A port exposed by an application running the service can serve a specific application protocol such as HTTP, TCP, gRPC etc. Since FSM filters and routes traffic for different application protocols differently, a configuration on the Kubernetes service object is necessary to convey to FSM how traffic directed to a service port must be routed.
In order to determine the application protocol served by a service’s port, FSM expects the appProtocol field on the service’s port to be set.
FSM supports the following application protocols for service ports:
http: For HTTP based filtering and routing of traffictcp: For TCP based filtering and routing of traffictcp-server-first: For TCP based filtering and routing of traffic where the server initiates communication with a client, such as mySQL, PostgreSQL, and othersgRPC: For HTTP2 based filtering and routing of gRPC traffic
The application protocol configuration described is applicable to both SMI and Permissive traffic policy modes.
Examples
Consider the following SMI traffic access and traffic specs policies:
- A
TCPRouteresource namedtcp-routethat specifies the port TCP traffic should be allowed on. - An
HTTPRouteGroupresource namedhttp-routethat specifies the HTTP routes for which HTTP traffic should be allowed. - A
TrafficTargetresource namedtestthat allows pods in the service accountsa-2to access pods in the service accountsa-1for the specified TCP and HTTP rules.
kind: TCPRoute
metadata:
  name: tcp-route
spec:
  matches:
    ports:
    - 8080
---
kind: HTTPRouteGroup
metadata:
  name: http-route
spec:
  matches:
  - name: version
    pathRegex: "/version"
    methods:
    - GET
---
kind: TrafficTarget
metadata:
  name: test
  namespace: default
spec:
  destination:
    kind: ServiceAccount
    name: sa-1 # There are 2 services under this service account:  service-1 and service-2
    namespace: default
  rules:
  - kind: TCPRoute
    name: tcp-route
  - kind: HTTPRouteGroup
    name: http-route
  sources:
  - kind: ServiceAccount
    name: sa-2
    namespace: default
Kubernetes service resources should explicitly specify the application protocol being served by the service’s ports using the appProtocol field.
A service service-1 backed by a pod in service account sa-1 serving http application traffic should be defined as follows:
kind: Service
metadata:
  name: service-1
  namespace: default
spec:
  ports:
  - port: 8080
    name: some-port
    appProtocol: http
A service service-2 backed by a pod in service account sa-1 serving raw tcp application traffic shold be defined as follows:
kind: Service
metadata:
  name: service-2
  namespace: default
spec:
  ports:
  - port: 8080
    name: some-port
    appProtocol: tcp
3 - Traffic Management
3.1 - Permissive Mode
Permissive traffic policy mode in FSM is a mode where SMI traffic access policy enforcement is bypassed. In this mode, FSM automatically discovers services that are a part of the service mesh and programs traffic policy rules on each Pipy proxy sidecar to be able to communicate with these services.
When to use permissive traffic policy mode
Since permissive traffic policy mode bypasses SMI traffic access policy enforcement, it is suitable for use when connectivity between applications within the service mesh should flow as before the applications were enrolled into the mesh. This mode is suitable in environments where explicitly defining traffic access policies for connectivity between applications is not feasible.
A common use case to enable permissive traffic policy mode is to support gradual onboarding of applications into the mesh without breaking application connectivity. Traffic routing between application services is automatically set up by FSM controller through service discovery. Wildcard traffic policies are set up on each Pipy proxy sidecar to allow traffic flow to services within the mesh.
The alternative to permissive traffic policy mode is SMI traffic policy mode, where traffic between applications is denied by default and explicit SMI traffic policies are necessary to allow application connectivity. When policy enforcement is necessary, SMI traffic policy mode must be used instead.
Configuring permissive traffic policy mode
Permissive traffic policy mode can be enabled or disabled at the time of FSM install, or after FSM has been installed.
Enabling permissive traffic policy mode
Enabling permissive traffic policy mode implicitly disables SMI traffic policy mode.
During FSM install using the --set flag:
fsm install --set fsm.enablePermissiveTrafficPolicy=true
After FSM has been installed:
# Assumes FSM is installed in the fsm-system namespace
kubectl patch meshconfig fsm-mesh-config -n fsm-system -p '{"spec":{"traffic":{"enablePermissiveTrafficPolicyMode":true}}}'  --type=merge
Disabling permissive traffic policy mode
Disabling permissive traffic policy mode implicitly enables SMI traffic policy mode.
During FSM install using the --set flag:
fsm install --set fsm.enablePermissiveTrafficPolicy=false
After FSM has been installed:
# Assumes FSM is installed in the fsm-system namespace
kubectl patch meshconfig fsm-mesh-config -n fsm-system -p '{"spec":{"traffic":{"enablePermissiveTrafficPolicyMode":false}}}'  --type=merge
How it works
When permissive traffic policy mode is enabled, FSM controller discovers all services that are a part of the mesh and programs wildcard traffic routing rules on each Pipy proxy sidecar to reach every other service in the mesh. Additionally, each proxy fronting workloads that are associated with a service is configured to accept all traffic destined to the service. Depending on the application protocol of the service (HTTP, TCP, gRPC etc.), appropriate traffic routing rules are configured on the Pipy sidecar to allow all traffic for that particular type.
Refer to the Permissive traffic policy mode demo to learn more.
Pipy configurations
In permissive mode, FSM controller programs wildcard routes for client applications to communicate with services. Following are the Pipy inbound and outbound filter and route configuration snippets from the curl and httpbin sidecar proxies.
Outbound Pipy configuration on the
curlclient pod:Outbound HTTP filter chain corresponding to the
httpbinservice:{ "Outbound": { "TrafficMatches": { "14001": [ { "DestinationIPRanges": [ "10.43.103.59/32" ], "Port": 14001, "Protocol": "http", "HttpHostPort2Service": { "httpbin": "httpbin.app.svc.cluster.local", "httpbin.app": "httpbin.app.svc.cluster.local", "httpbin.app.svc": "httpbin.app.svc.cluster.local", "httpbin.app.svc.cluster": "httpbin.app.svc.cluster.local", "httpbin.app.svc.cluster.local": "httpbin.app.svc.cluster.local", "httpbin.app.svc.cluster.local:14001": "httpbin.app.svc.cluster.local", "httpbin.app.svc.cluster:14001": "httpbin.app.svc.cluster.local", "httpbin.app.svc:14001": "httpbin.app.svc.cluster.local", "httpbin.app:14001": "httpbin.app.svc.cluster.local", "httpbin:14001": "httpbin.app.svc.cluster.local" }, "HttpServiceRouteRules": { "httpbin.app.svc.cluster.local": { ".*": { "Headers": null, "Methods": null, "TargetClusters": { "app/httpbin|14001": 100 }, "AllowedServices": null } } }, "TargetClusters": null, "AllowedEgressTraffic": false, "ServiceIdentity": "default.app.cluster.local" } ] } } }Outbound route configuration:
"HttpServiceRouteRules": {
        "httpbin.app.svc.cluster.local": {
          ".*": {
            "Headers": null,
            "Methods": null,
            "TargetClusters": {
              "app/httpbin|14001": 100
            },
            "AllowedServices": null
          }
        }
      }
Inbound Pipy configuration on the
httpbinservice pod:Inbound HTTP filter chain corresponding to the
httpbinservice:{ "Inbound": { "TrafficMatches": { "14001": { "SourceIPRanges": null, "Port": 14001, "Protocol": "http", "HttpHostPort2Service": { "httpbin": "httpbin.app.svc.cluster.local", "httpbin.app": "httpbin.app.svc.cluster.local", "httpbin.app.svc": "httpbin.app.svc.cluster.local", "httpbin.app.svc.cluster": "httpbin.app.svc.cluster.local", "httpbin.app.svc.cluster.local": "httpbin.app.svc.cluster.local", "httpbin.app.svc.cluster.local:14001": "httpbin.app.svc.cluster.local", "httpbin.app.svc.cluster:14001": "httpbin.app.svc.cluster.local", "httpbin.app.svc:14001": "httpbin.app.svc.cluster.local", "httpbin.app:14001": "httpbin.app.svc.cluster.local", "httpbin:14001": "httpbin.app.svc.cluster.local" }, "HttpServiceRouteRules": { "httpbin.app.svc.cluster.local": { ".*": { "Headers": null, "Methods": null, "TargetClusters": { "app/httpbin|14001|local": 100 }, "AllowedServices": null } } }, "TargetClusters": null, "AllowedEndpoints": null } } } }Inbound route configuration:
"HttpServiceRouteRules": {
  "httpbin.app.svc.cluster.local": {
    ".*": {
      "Headers": null,
      "Methods": null,
      "TargetClusters": {
        "app/httpbin|14001|local": 100
      },
      "AllowedServices": null
    }
  }
}
3.2 - Traffic Redirection
iptables is a traffic interception tool based on the Linux kernel. It can control traffic by filtering rules. Its advantages include:
- Universality: The iptables tool has been widely used in Linux operating systems, so most Linux users are familiar with its usage.
- Stability: iptables has long been part of the Linux kernel, so it has a high degree of stability.
- Flexibility: iptables can be flexibly configured according to needs to control network traffic.
However, iptables also has some disadvantages:
- Difficult to debug: Due to the complexity of the iptables tool itself, it is relatively difficult to debug.
- Performance issues: Unpredictable latency and reduced performance as the number of services grows.
- Issues with handling complex traffic: When it comes to handling complex traffic, iptables may not be suitable because its rule processing is not flexible enough.
eBPF is an advanced traffic interception tool that can intercept and analyze traffic in the Linux kernel through custom programs. The advantages of eBPF include:
- Flexibility: eBPF can use custom programs to intercept and analyze traffic, so it has higher flexibility.
- Scalability: eBPF can dynamically load and unload programs, so it has higher scalability.
- Efficiency: eBPF can perform processing in the kernel space, so it has higher performance.
However, eBPF also has some disadvantages:
- Higher learning curve: eBPF is relatively new compared to iptables, so it requires some learning costs.
- Complexity: Developing custom eBPF programs may be more complex.
Overall, iptables is more suitable for simple traffic filtering and management, while eBPF is more suitable for complex traffic interception and analysis scenarios that require higher flexibility and performance.
3.2.1 - Iptables Redirection
FSM leverages iptables to intercept and redirect traffic to and from pods participating in the service mesh to the Pipy proxy sidecar container running on each pod. Traffic redirected to the Pipy proxy sidecar is filtered and routed based on service mesh traffic policies.
For more details of comparison between iptables and eBPF, you can refer to Traffic Redirection.
How it works
FSM sidecar injector service fsm-injector injects an Pipy proxy sidecar on every pod created within the service mesh. Along with the Pipy proxy sidecar, fsm-injector also injects an init container, a specialized container that runs before any application containers in a pod. The injected init container is responsible for bootstrapping the application pods with traffic redirection rules such that all outbound TCP traffic from a pod and all inbound traffic TCP traffic to a pod are redirected to the pipy proxy sidecar running on that pod. This redirection is set up by the init container by running a set of iptables commands.
Ports reserved for traffic redirection
FSM reserves a set of port numbers to perform traffic redirection and provide admin access to the Pipy proxy sidecar. It is essential to note that these port numbers must not be used by application containers running in the mesh. Using any of these reserved port numbers will lead to the Pipy proxy sidecar not functioning correctly.
Following are the port numbers that are reserved for use by FSM:
15000: used by the Pipy admin interface exposed overlocalhostto return current configuration files.15001: used by the Pipy outbound listener to accept and proxy outbound traffic sent by applications within the pod15003: used by the Pipy inbound listener to accept and proxy inbound traffic entering the pod destined to applications within the pod15010: used by the Pipy inbound Prometheus listener to accept and proxy inbound traffic pertaining to scraping Pipy’s Prometheus metrics15901: used by Pipy to serve rewritten HTTP liveness probes15902: used by Pipy to serve rewritten HTTP readiness probes15903: used by Pipy to serve rewritten HTTP startup probes
The following are the port numbers that are reserved for use by FSM and allow traffic to bypass Pipy:
15904: used byfsm-healthcheckto servetcpSockethealth probes rewritten tohttpGethealth probes
Application User ID (UID) reserved for traffic redirection
FSM reserves the user ID (UID) value 1500 for the Pipy proxy sidecar container. This user ID is of utmost importance while performing traffic interception and redirection to ensure the redirection does not result in a loop. The user ID value 1500 is used to program redirection rules to ensure redirected traffic from Pipy is not redirected back to itself!
Application containers must not used the reserved user ID value of 1500.
Types of traffic intercepted
Currently, FSM programs the Pipy proxy sidecar on each pod to only intercept inbound and outbound TCP traffic. This includes raw TCP traffic and any application traffic that uses TCP as the underlying transport protocol, such as HTTP, gRPC etc. This implies UDP and ICMP traffic which can be intercepted by iptables are not intercepted and redirected to the Pipy proxy sidecar.
Iptables chains and rules
FSM’s fsm-injector service programs the init container to set up a set of iptables chains and rules to perform traffic interception and redirection. The following section provides details on the responsibility of these chains and rules.
FSM leverages four chains to perform traffic interception and redirection:
PROXY_INBOUND: chain to intercept inbound traffic entering the podPROXY_IN_REDIRECT: chain to redirect intercepted inbound traffic to the sidecar proxy’s inbound listenerPROXY_OUTPUT: chain to intercept outbound traffic from applications within the podPROXY_REDIRECT: chain to redirect intercepted outbound traffic to the sidecar proxy’s outbound listener
Each of the chains above are programmed with rules to intercept and redirect application traffic via the Pipy proxy sidecar.
Outbound IP range exclusions
Outbound TCP based traffic from applications is by default intercepted using the iptables rules programmed by FSM, and redirected to the Pipy proxy sidecar. In some cases, it might be desirable to not subject certain IP ranges to be redirected and routed by the Pipy proxy sidecar based on service mesh policies. A common use case to exclude IP ranges is to not route non-application logic based traffic via the Pipy proxy, such as traffic destined to the Kubernetes API server, or traffic destined to a cloud provider’s instance metadata service. In such scenarios, excluding certain IP ranges from being subject to service mesh traffic routing policies becomes necessary.
Outbound IP ranges can be excluded at a global mesh scope or per pod scope.
1. Global outbound IP range exclusions
FSM provides the means to specify a global list of IP ranges to exclude from outbound traffic interception applicable to all pods in the mesh, as follows:
During FSM install using the
--setoption:# To exclude the IP ranges 1.1.1.1/32 and 2.2.2.2/24 from outbound interception fsm install --set=fsm.outboundIPRangeExclusionList="{1.1.1.1/32,2.2.2.2/24}"By setting the
outboundIPRangeExclusionListfield in thefsm-mesh-configresource:## Assumes FSM is installed in the fsm-system namespace kubectl patch meshconfig fsm-mesh-config -n fsm-system -p '{"spec":{"traffic":{"outboundIPRangeExclusionList":["1.1.1.1/32", "2.2.2.2/24"]}}}' --type=mergeWhen IP ranges are set for exclusion post-install, make sure to restart the pods in monitored namespaces for this change to take effect.
Globally excluded IP ranges are stored in the fsm-mesh-config MeshConfig custom resource and are read at the time of sidecar injection by fsm-injector. These dynamically configurable IP ranges are programmed by the init container along with the static rules used to intercept and redirect traffic via the Pipy proxy sidecar. Excluded IP ranges will not be intercepted for traffic redirection to the Pipy proxy sidecar. Refer to the outbound IP range exclusion demo to learn more.
2. Pod scoped outbound IP range exclusions
Outbound IP range exclusions can be configured at pod scope by annotating the pod to specify a comma separated list of IP CIDR ranges as flomesh.io/outbound-ip-range-exclusion-list=<comma separated list of IP CIDRs>.
# To exclude the IP ranges 10.244.0.0/16 and 10.96.0.0/16 from outbound interception on the pod
kubectl annotate pod <pod> flomesh.io/outbound-ip-range-exclusion-list="10.244.0.0/16,10.96.0.0/16"
When IP ranges are annotated post pod creation, make sure to restart the corresponding pods for this change to take effect.
Outbound IP range inclusions
Outbound TCP based traffic from applications is by default intercepted using the iptables rules programmed by FSM, and redirected to the Pipy proxy sidecar. In some cases, it might be desirable to only subject certain IP ranges to be redirected and routed by the Pipy proxy sidecar based on service mesh policies, and have remaining traffic not proxied to the sidecar. In such scenarios, inclusion IP ranges can be specified.
Outbound inclusion IP ranges can be specified at a global mesh scope or per pod scope.
1. Global outbound IP range inclusions
FSM provides the means to specify a global list of IP ranges to include for outbound traffic interception applicable to all pods in the mesh, as follows:
During FSM install using the
--setoption:# To include the IP ranges 1.1.1.1/32 and 2.2.2.2/24 for outbound interception fsm install --set=fsm.outboundIPRangeInclusionList="[1.1.1.1/32,2.2.2.2/24]"By setting the
outboundIPRangeInclusionListfield in thefsm-mesh-configresource:## Assumes FSM is installed in the fsm-system namespace kubectl patch meshconfig fsm-mesh-config -n fsm-system -p '{"spec":{"traffic":{"outboundIPRangeInclusionList":["1.1.1.1/32", "2.2.2.2/24"]}}}' --type=mergeWhen IP ranges are set for inclusion post-install, make sure to restart the pods in monitored namespaces for this change to take effect.
Globally included IP ranges are stored in the fsm-mesh-config MeshConfig custom resource and are read at the time of sidecar injection by fsm-injector. These dynamically configurable IP ranges are programmed by the init container along with the static rules used to intercept and redirect traffic via the Pipy proxy sidecar. IP addresses outside the specified inclusion IP ranges will not be intercepted for traffic redirection to the Pipy proxy sidecar.
2. Pod scoped outbound IP range inclusions
Outbound IP range inclusions can be configured at pod scope by annotating the pod to specify a comma separated list of IP CIDR ranges as flomesh.io/outbound-ip-range-inclusion-list=<comma separated list of IP CIDRs>.
# To include the IP ranges 10.244.0.0/16 and 10.96.0.0/16 for outbound interception on the pod
kubectl annotate pod <pod> flomesh.io/outbound-ip-range-inclusion-list="10.244.0.0/16,10.96.0.0/16"
When IP ranges are annotated post pod creation, make sure to restart the corresponding pods for this change to take effect.
Outbound port exclusions
Outbound TCP based traffic from applications is by default intercepted using the iptables rules programmed by FSM, and redirected to the Pipy proxy sidecar. In some cases, it might be desirable to not subject certain ports to be redirected and routed by the Pipy proxy sidecar based on service mesh policies. A common use case to exclude ports is to not route non-application logic based traffic via the Pipy proxy, such as control plane traffic. In such scenarios, excluding certain ports from being subject to service mesh traffic routing policies becomes necessary.
Outbound ports can be excluded at a global mesh scope or per pod scope.
1. Global outbound port exclusions
FSM provides the means to specify a global list of ports to exclude from outbound traffic interception applicable to all pods in the mesh, as follows:
During FSM install using the
--setoption:# To exclude the ports 6379 and 7070 from outbound sidecar interception fsm install --set=fsm.outboundPortExclusionList="{6379,7070}"By setting the
outboundPortExclusionListfield in thefsm-mesh-configresource:## Assumes FSM is installed in the fsm-system namespace kubectl patch meshconfig fsm-mesh-config -n fsm-system -p '{"spec":{"traffic":{"outboundPortExclusionList":[6379, 7070]}}}' --type=mergeWhen ports are set for exclusion post-install, make sure to restart the pods in monitored namespaces for this change to take effect.
Globally excluded ports are are stored in the fsm-mesh-config MeshConfig custom resource and are read at the time of sidecar injection by fsm-injector. These dynamically configurable ports are programmed by the init container along with the static rules used to intercept and redirect traffic via the Pipy proxy sidecar. Excluded ports will not be intercepted for traffic redirection to the Pipy proxy sidecar.
2. Pod scoped outbound port exclusions
Outbound port exclusions can be configured at pod scope by annotating the pod with a comma separated list of ports as flomesh.io/outbound-port-exclusion-list=<comma separated list of ports>:
# To exclude the ports 6379 and 7070 from outbound interception on the pod
kubectl annotate pod <pod> flomesh.io/outbound-port-exclusion-list=6379,7070
When ports are annotated post pod creation, make sure to restart the corresponding pods for this change to take effect.
Inbound port exclusions
Similar to outbound port exclusions described above, inbound traffic on pods can be excluded from being proxied to the sidecar based on the ports the traffic is directed to.
1. Global inbound port exclusions
FSM provides the means to specify a global list of ports to exclude from inbound traffic interception applicable to all pods in the mesh, as follows:
During FSM install using the
--setoption:# To exclude the ports 6379 and 7070 from inbound sidecar interception fsm install --set=fsm.inboundPortExclusionList="[6379,7070]"By setting the
inboundPortExclusionListfield in thefsm-mesh-configresource:## Assumes FSM is installed in the fsm-system namespace kubectl patch meshconfig fsm-mesh-config -n fsm-system -p '{"spec":{"traffic":{"inboundPortExclusionList":[6379, 7070]}}}' --type=mergeWhen ports are set for exclusion post-install, make sure to restart the pods in monitored namespaces for this change to take effect.
2. Pod scoped inbound port exclusions
Inbound port exclusions can be configured at pod scope by annotating the pod with a comma separated list of ports as flomesh.io/inbound-port-exclusion-list=<comma separated list of ports>:
# To exclude the ports 6379 and 7070 from inbound sidecar interception on the pod
kubectl annotate pod <pod> flomesh.io/inbound-port-exclusion-list=6379,7070
When ports are annotated post pod creation, make sure to restart the corresponding pods for this change to take effect.
3.2.2 - eBPF Redirection
FSM comes with eBPF functionality and provides users an options to use eBPF over default iptables.
The minimum kernel version is 5.4.
This guide shows how to start using this new functionality and enjoy the benefits eBPF. If you want to directly jump into quick start, refer to eBPF setup quickstart guide
For more details of comparison between iptables and eBPF, you can refer to Traffic Redirection.
Architecture
To provide eBPF features, Flomesh Service Mesh provides the fsm-cni CNI implementation and fsm-interceptor running on each node, where fsm-cni is compatible with mainstream CNI plugins.
When kubelet creates a pod on a node, it calls the CNI interface through the container runtime CRI to create the pod’s network namespace. After the pod’s network namespace is created, fsm-cni calls the interface of fsm-interceptor to load the BPF program and attach it to the hook point. In addition, fsm-interceptor also maintains pod information in eBPF Maps.
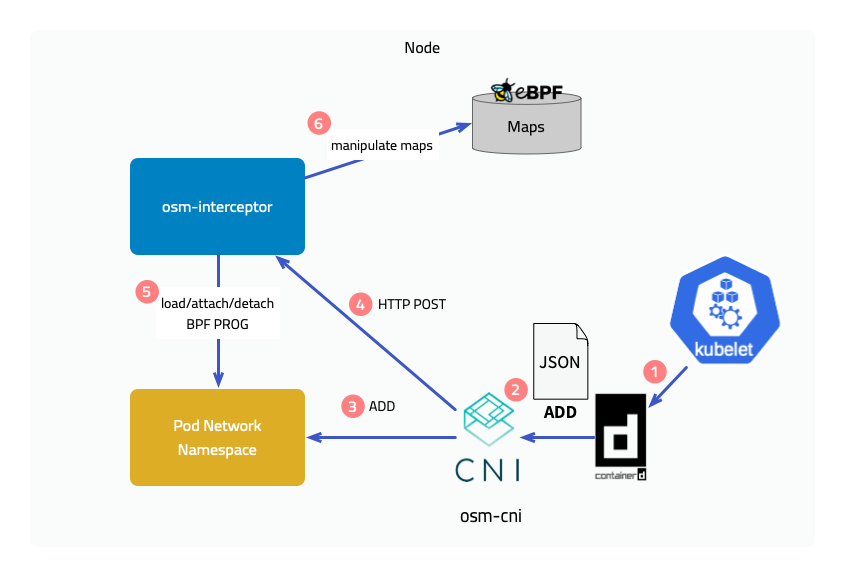
Implementation Principles
Next, we will introduce the implementation principles of the two features brought by the introduction of eBPF, but please note that many processing details will be ignored here.
Traffic interception
Outbound traffic
The figure below shows the interception of outbound traffic. Attach a BPF program to the socket operation connect, and in the program determine whether the current pod is managed by the service mesh, that is, whether it has a sidecar injected, and then modify the destination address to 127.0.0.1 and the destination port to the sidecar’s outbound port 15003. It is not enough to just modify it. The original destination address and port should also be saved in a map, using the socket’s cookie as the key.
After the connection with the sidecar is established, the original destination is saved in another map through a program attached to the mount point sock_ops, using local address + port and remote address + port as the key. When the sidecar accesses the target application later, it obtains the original destination through the getsockopt operation on the socket. Yes, a eBPF program is also attached to getsockopt, which retrieves the original destination address from the map and returns it.
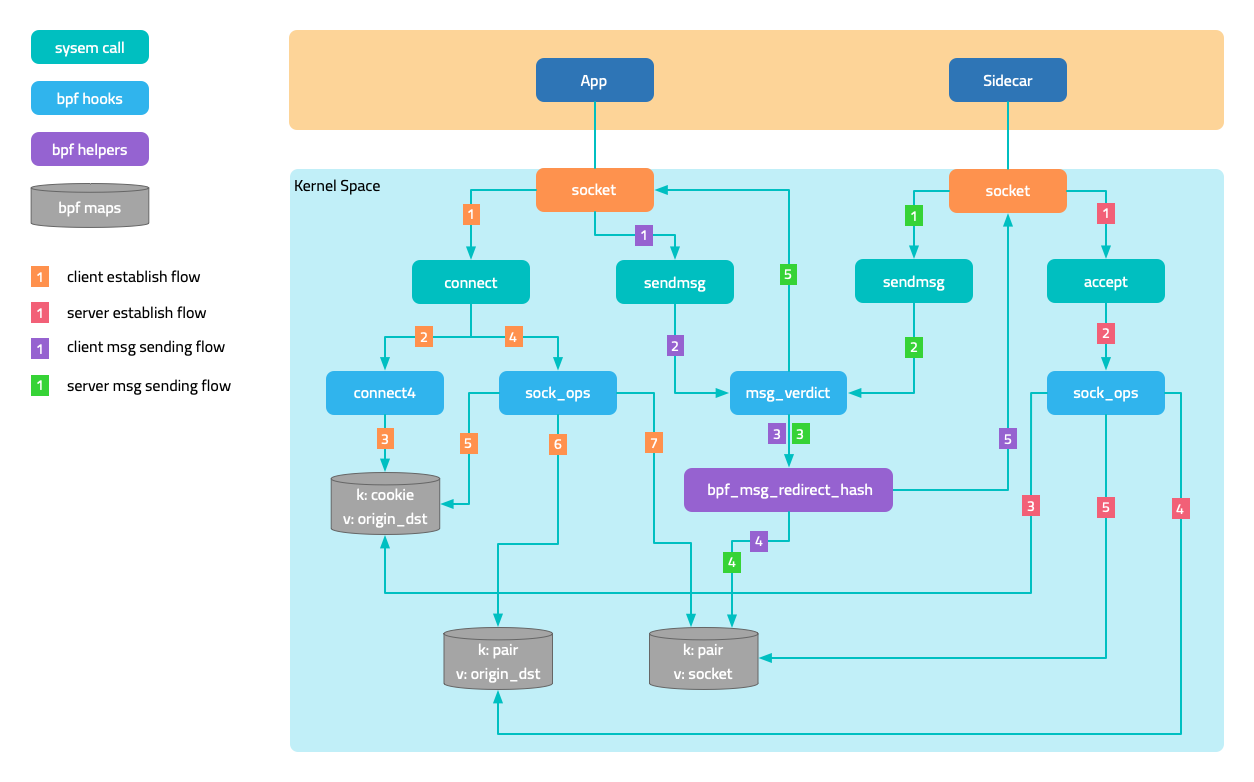
Inbound traffic
For the interception of inbound traffic, the traffic originally intended for the application port is forwarded to the sidecar’s inbound port 15003. There are two cases:
- In the first case, the requester and the service are located on the same node. After the requester’s sidecar connect operation is intercepted, the destination port is changed to
15003. - In the second case, the requester and the service are located on different nodes. When the handshake packet reaches the service’s network namespace, it is intercepted by the BPF program attached to the tc (traffic control) ingress, and the port is modified to
15003, achieving a functionality similar to DNAT.
Network communication acceleration
In Kubernetes networks, network packets unavoidably undergo multiple kernel network protocol stack processing. eBPF accelerates network communication by bypassing unnecessary kernel network protocol stack processing and directly exchanging data between two sockets that are peers.
The figure in the traffic interception section shows the sending and receiving trajectories of messages. When the program attached to sock_ops discovers that the connection is successfully established, it saves the socket in a map, using local address + port and remote address + port as the key. As the two sockets are peers, their local and remote information is opposite, so when a socket sends a message, it can directly address the peer socket from the map.
This solution also applies to communication between two pods on the same node.
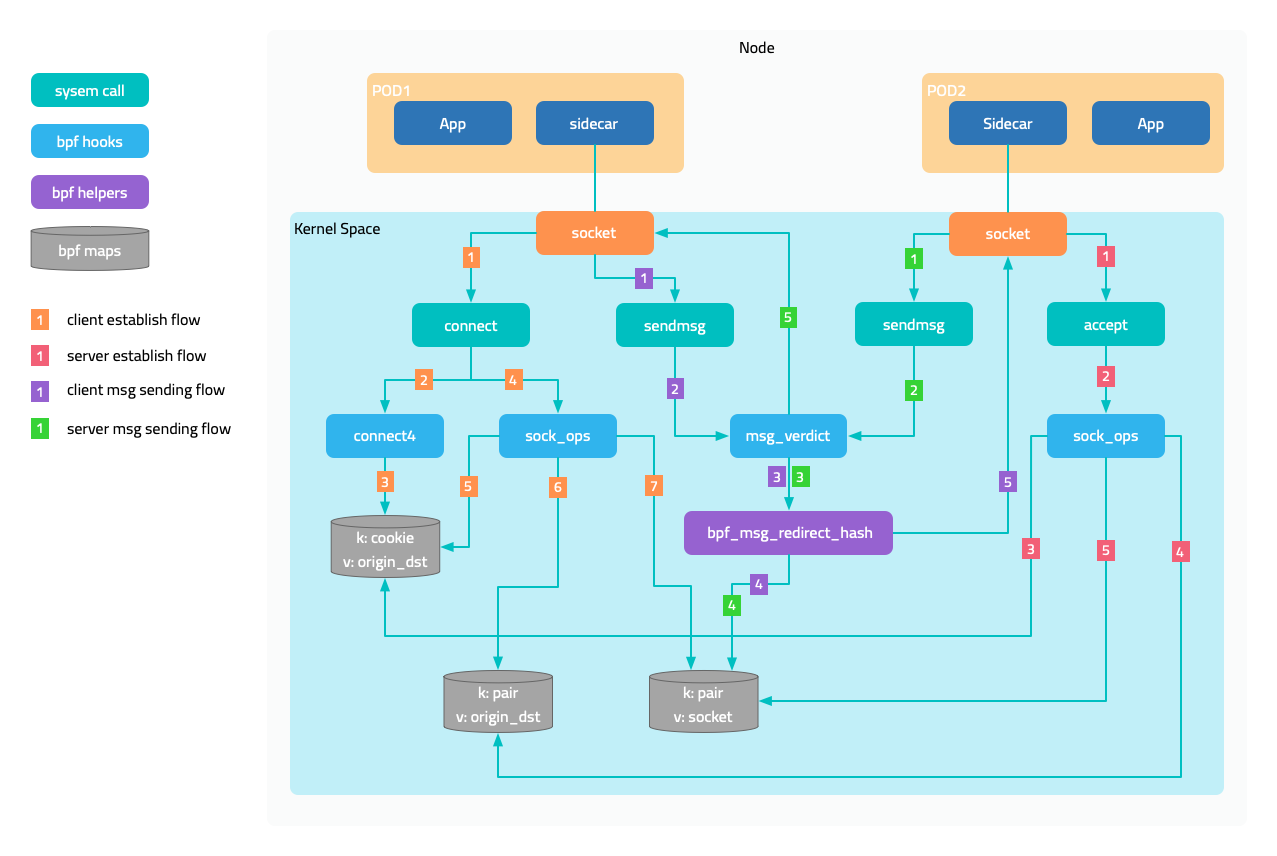
Prerequisites
- Ubuntu 20.04
- Kernel 5.15.0-1034
- 2c4g VM * 3:master、node1、node2
Install CNI Plugin
Execute the following command on all nodes to download the CNI plugin.
sudo mkdir -p /opt/cni/bin
curl -sSL https://github.com/containernetworking/plugins/releases/download/v1.1.1/cni-plugins-linux-amd64-v1.1.1.tgz | sudo tar -zxf - -C /opt/cni/bin
Master Node
Get the IP address of the master node. (Your machine IP might be different)
export MASTER_IP=10.0.2.6
Kubernetes cluster uses the k3s distribution, but when installing the cluster, you need to disable the flannel integrated by k3s and use independently installed flannel for validation. This is because k3s’s doesn’t follow Flannel directory structure /opt/cni/bin and store its CNI bin directory at /var/lib/rancher/k3s/data/xxx/bin where xxx is some randomly generated text.
curl -sfL https://get.k3s.io | sh -s - --disable traefik --disable servicelb --flannel-backend=none --advertise-address $MASTER_IP --write-kubeconfig-mode 644 --write-kubeconfig ~/.kube/config
Install Flannel. Note that the default Pod CIDR of Flannel is 10.244.0.0/16, and we will modify it to k3s’s default 10.42.0.0/16.
curl -s https://raw.githubusercontent.com/flannel-io/flannel/master/Documentation/kube-flannel.yml | sed 's|10.244.0.0/16|10.42.0.0/16|g' | kubectl apply -f -
Get the access token of the API server for initializing worker nodes.
sudo cat /var/lib/rancher/k3s/server/node-token
Worker Node
Use the IP address of the master node and the token obtained earlier to initialize the node.
export INSTALL_K3S_VERSION=v1.23.8+k3s2
export NODE_TOKEN=K107c1890ae060d191d347504740566f9c506b95ea908ba4795a7a82ea2c816e5dc::server:2757787ec4f9975ab46b5beadda446b7
curl -sfL https://get.k3s.io | K3S_URL=https://${MASTER_IP}:6443 K3S_TOKEN=${NODE_TOKEN} sh -
Download FSM CLI
system=$(uname -s | tr [:upper:] [:lower:])
arch=$(dpkg --print-architecture)
release=v1.3.3
curl -L https://github.com/flomesh-io/fsm/releases/download/${release}/fsm-${release}-${system}-${arch}.tar.gz | tar -vxzf -
./${system}-${arch}/fsm version
sudo cp ./${system}-${arch}/fsm /usr/local/bin/
Install FSM
export fsm_namespace=fsm-system
export fsm_mesh_name=fsm

fsm install \
    --mesh-name "$fsm_mesh_name" \
    --fsm-namespace "$fsm_namespace" \
    --set=fsm.trafficInterceptionMode=ebpf \
    --set=fsm.fsmInterceptor.debug=true \
    --timeout=900s
Deploy Sample Application
#Sample services
kubectl create namespace ebpf
fsm namespace add ebpf

kubectl apply -n ebpf -f https://raw.githubusercontent.com/flomesh-io/fsm-docs/main/manifests/samples/interceptor/curl.yaml
kubectl apply -n ebpf -f https://raw.githubusercontent.com/flomesh-io/fsm-docs/main/manifests/samples/interceptor/pipy-ok.yaml

#Schedule Pods to Different Nodes
kubectl patch deployments curl -n ebpf -p '{"spec":{"template":{"spec":{"nodeName":"node1"}}}}'
kubectl patch deployments pipy-ok-v1 -n ebpf -p '{"spec":{"template":{"spec":{"nodeName":"node1"}}}}'
kubectl patch deployments pipy-ok-v2 -n ebpf -p '{"spec":{"template":{"spec":{"nodeName":"node2"}}}}'

sleep 5

#Wait for dependent Pods to start successfully
kubectl wait --for=condition=ready pod -n ebpf -l app=curl --timeout=180s
kubectl wait --for=condition=ready pod -n ebpf -l app=pipy-ok -l version=v1 --timeout=180s
kubectl wait --for=condition=ready pod -n ebpf -l app=pipy-ok -l version=v2 --timeout=180s
Testing
During testing, you can view the debug logs of BPF program execution by viewing the kernel tracing logs on the worker node using the following command. To avoid interference caused by sidecar communication with the control plane, first obtain the IP address of the control plane.
kubectl get svc -n fsm-system fsm-controller -o jsonpath='{.spec.clusterIP}'
10.43.241.189
Execute the following command on both worker nodes.
sudo cat /sys/kernel/debug/tracing/trace_pipe | grep bpf_trace_printk | grep -v '10.43.241.189'
Execute the following command on both worker nodes.
curl_client="$(kubectl get pod -n ebpf -l app=curl -o jsonpath='{.items[0].metadata.name}')"
kubectl exec ${curl_client} -n ebpf -c curl -- curl -s pipy-ok:8080
You should receive results similar to the following, and the kernel tracing logs should also output the debug logs of the BPF program accordingly (the content is quite long, so it will not be shown here).
Hi, I am pipy ok v1 !
Hi, I am pipy ok v2 !
3.3 - Traffic Splitting
The SMI Traffic Split API can be used to split outgoing traffic to multiple service backends. This can be used to orchestrate canary releases for multiple versions of the software.
What is supported
FSM implements the SMI traffic split v1alpha4 version.
It supports the following:
- Traffic splitting in both SMI and Permissive traffic policy modes
- HTTP and TCP traffic splitting
- Traffic splitting for canary or blue-green deployments
How it works
Outbound traffic destined to a Kubernetes service can be split to multiple service backends using the SMI Traffic Split API. Consider the following example where traffic to the bookstore.default.svc.cluster.local FQDN corresponding to the default/bookstore service is split to services default/bookstore-v1 and default/bookstore-v2, with a weight of 90 and 10 respectively.
apiVersion: split.smi-spec.io/v1alpha4
kind: TrafficSplit
metadata:
  name: bookstore-split
  namespace: default
spec:
  service: bookstore.default.svc.cluster.local
  backends:
  - service: bookstore-v1
    weight: 90
  - service: bookstore-v2
    weight: 10
For a TrafficSplit resource to be correctly configured, it is important to ensure the following conditions are met:
metadata.namespaceis a namespace added to the meshmetadata.namespace,spec.service, andspec.backendsall belong to the same namespacespec.servicespecifies an FQDN of a Kubernetes servicespec.serviceandspec.backendscorrespond to Kubernetes service objects- The total weight of all backends must be greater than zero, and each backend must have a positive weight
When a TrafficSplit resource is created, FSM applies the configuration on client sidecars to split traffic directed to the root service (spec.service) to the backends (spec.backends) based the specified weights. For HTTP traffic, the Host/Authority header in the request must match the FQDNs of the root service specified in the TrafficSplit resource. In the above example, it implies that the Host/Authority header in the HTTP request originated by the client must match the Kubernetes service FQDNs of the default/bookstore service for traffic split to work.
Note: FSM does not configure
Host/Authorityheader rewrites for the original HTTP requests, so it is necessary that the backend services referenced in aTrafficSplitresource accept requests with the original HTTPHost/Authorityheader.
It is important to note that a TrafficSplit resource only configures traffic splitting to a service, and does not give applications permission to communicate with each other. Thus, a valid TrafficTarget resource must be configured in conjunction with a TrafficSplit configuration to achieve traffic flow between applications as desired.
Refer to a demo on Canary rollouts using SMI Traffic Split to learn more.
3.4 - Circuit Breaking
Circuit breaking is a critical component of distributed systems and an important resiliency pattern. Circuit breaking allows applications to fail quickly and apply back pressure downstream as soon as possible, thereby providing the means to limit the impact of failures across the system. This guide describes how circuit breaking can be configured in FSM.
Configuring circuit breaking
FSM leverages its UpstreamTrafficSetting API to configure circuit breaking attributes for traffic directed to an upstream service. We use the term upstream service to refer to a service that receives connections and requests from clients and return responses. The specification enables configuring circuit breaking attributes for an upstream service at the connection and request level.
Each UpstreamTrafficSetting configuration targets an upstream host defined by the spec.host field. For a Kubernetes service my-svc in the namespace my-namespace, the UpstreamTrafficSetting resource must be created in the namespace my-namespace, and spec.host must be an FQDN of the form my-svc.my-namespace.svc.cluster.local. When specified as a match in an Egress policy, spec.host must correspond to the host specified in the Egress policy and the UpstreamTrafficSetting configuration must belong to the same namespace as the Egress resource.
Circuit breaking is applicable at both the TCP and HTTP level, and can be configured using the connectionSettings attribute in the UpstreamTrafficSetting resource. TCP traffic settings apply to both TCP and HTTP traffic, while HTTP settings only apply to HTTP traffic.
The following circuit breaking configurations are supported:
Maximum connections: The maximum number of connections that a client is allowed to establish to all backends belonging to the upstream host specified via thespec.hostfield in theUpstreamTrafficSettingconfiguration. This setting can be configured using thetcp.maxConnectionsfield and is applicable to both TCP and HTTP traffic. If not specified, the default is4294967295(2^32 - 1).Maximum pending requests: The maximum number of pending HTTP requests to the upstream host that are allowed to be queued. Requests are added to the list of pending requests whenever there aren’t enough upstream connections available to immediately dispatch the request. For HTTP/2 connections, ifhttp.maxRequestsPerConnectionis not configured, all requests will be multiplexed over the same connection so this circuit breaker will only be hit when no connection is already established. This setting can be configured using thehttp.maxPendingRequestsfield and is only applicable to HTTP traffic. If not specified, the default is4294967295(2^32 - 1).Maximum requests: The maximum number of parallel request that a client is allowed to make to the upstream host. This setting can be configured using thehttp.maxRequestsfield and is only applicable to HTTP traffic. If not specified, the default is4294967295(2^32 - 1).Maximum requests per connection: The maximum number of requests allowed per connection. This setting can be configured using thehttp.maxRequestsPerConnectionfield and is only applicable to HTTP traffic. If not specified, there is no limit.Maximum active retries: The maximum number of active retries that a client is allowed to make to the upstream host. This setting can be configured using thehttp.maxRetriesfield and is only applicable to HTTP traffic. If not specified, the default is4294967295(2^32 - 1).
To learn more about configuring circuit breaking, refer to the following demo guides:
3.5 - Retry
Retry is a resiliency pattern that enables an application to shield transient issues from customers. This is done by retrying requests that are failing from temporary faults such as a pod is starting up. This guide describes how to implement retry policy in FSM.
Configuring Retry
FSM uses its Retry policy API to allow retries on traffic from a specified source (ServiceAccount) to one or more destinations (Service). Retry is only applicable to HTTP traffic. FSM can implement retry for applications participating in the mesh.
The following retry configurations are supported:
Per Try Timeout: The time allowed for a retry to take before it is considered a failed attempt. The default uses the global route timeout.Retry Backoff Base Interval: The base interval for exponential retry back-off. The backoff is randomly chosen from the range [0,(2**N-1)B], where N is the retry number and B is the base interval. The default is25msand the maximum interval is 10 times the base interval.Number of Retries: The maximum number of retries to attempt. The default is1.Retry On: Specifies the policy for when a failed request will be retried. Multiple policies can be specified by using a,delimited list.
To learn more about configuring retry, refer to the Retry policy demo and [API documentation][1].
Examples
If requests from the bookbuyer service to bookstore-v1 service or bookstore-v2 service receive responses with a status code 5xx, then bookbuyer will retry the request 3 times. If an attempted retry takes longer than 3s it’s considered a failed attempt. Each retry has a delay period (backoff) before it is attempted calculated above. The backoff for all retries is capped at 10s.
kind: Retry
apiVersion: policy.flomesh.io/v1alpha1
metadata:
  name: retry
spec:
  source:
    kind: ServiceAccount
    name: bookbuyer
    namespace: bookbuyer
  destinations:
  - kind: Service
    name: bookstore
    namespace: bookstore-v1
  - kind: Service
    name: bookstore
    namespace: bookstore-v2
  retryPolicy:
    retryOn: "5xx"
    perTryTimeout: 3s
    numRetries: 3
    retryBackoffBaseInterval: 1s
If requests from the bookbuyer service to bookstore-v2 service receive responses with a status code 5xx or retriable-4xx (409), then bookbuyer will retry the request 5 times. If an attempted retry takes longer than 4s it’s considered a failed attempt. Each retry has a delay period (backoff) before it is attempted calculated above. The backoff for all retries is capped at 20ms.
kind: Retry
apiVersion: policy.flomesh.io/v1alpha1
metadata:
  name: retry
spec:
  source:
    kind: ServiceAccount
    name: bookbuyer
    namespace: bookbuyer
  destinations:
  - kind: Service
    name: bookstore
    namespace: bookstore-v2
  retryPolicy:
    retryOn: "5xx,retriable-4xx"
    perTryTimeout: 4s
    numRetries: 5
    retryBackoffBaseInterval: 2ms
3.6 - Rate Limiting
Rate limiting is an effective mechanism to control the throughput of traffic destined to a target host. It puts a cap on how often downstream clients can send network traffic within a certain timeframe.
Most commonly, when a large number of clients are sending traffic to a target host, if the target host becomes backed up, the downstream clients will overwhelm the upstream target host. In this scenario it is extremely difficult to configure a tight enough circuit breaking limit on each downstream host such that the system will operate normally during typical request patterns but still prevent cascading failure when the system starts to fail. In such scenarios, rate limiting traffic to the target host is effective.
FSM supports server-side rate limiting per target host, also referred to as local per-instance rate limiting.
Configuring local per-instance rate limiting
FSM leverages its UpstreamTrafficSetting API to configure rate limiting attributes for traffic directed to an upstream service. We use the term upstream service to refer to a service that receives connections and requests from clients and return responses. The specification enables configuring local rate limiting attributes for an upstream service at the connection and request level.
Each UpstreamTrafficSetting configuration targets an upstream host defined by the spec.host field. For a Kubernetes service my-svc in the namespace my-namespace, the UpstreamTrafficSetting resource must be created in the namespace my-namespace, and spec.host must be an FQDN of the form my-svc.my-namespace.svc.cluster.local.
Local rate limiting is applicable at both the TCP (L4) connection and HTTP request level, and can be configured using the rateLimit.local attribute in the UpstreamTrafficSetting resource. TCP settings apply to both TCP and HTTP traffic, while HTTP settings only apply to HTTP traffic. Both TCP and HTTP level rate limiting is enforced using a token bucket rate limiter.
Rate limiting TCP connections
TCP connections can be rate limited per unit of time. An optional burst limit can be specified to allow a burst of connections above the baseline rate to accommodate for connection bursts in a short interval of time. TCP rate limiting is applied as a token bucket rate limiter at the network filter chain of the upstream service’s inbound listener. Each incoming connection processed by the filter consumes a single token. If the token is available, the connection will be allowed. If no tokens are available, the connection will be immediately closed.
The following attributes nested under spec.rateLimit.local.tcp define the rate limiting attributes for TCP connections:
connections: The number of connections allowed per unit of time before rate limiting occurs on all backends belonging to the upstream host specified via thespec.hostfield in theUpstreamTrafficSettingconfiguration. This setting is applicable to both TCP and HTTP traffic.unit: The period of time within which connections over the limit will be rate limited. Valid values aresecond,minuteandhour.burst: The number of connections above the baseline rate that are allowed in a short period of time.
Refer to the TCP local rate limiting API for additional information regarding API usage.
Rate limiting HTTP requests
HTTP requests can be rate limited per unit of time. An optional burst limit can be specified to allow a burst of requests above the baseline rate to accommodate for request bursts in a short interval of time. HTTP rate limiting is applied as a token bucket rate limiter at the virtual host and/or HTTP route level at the upstream backend, depending on the rate limiting configuration. Each incoming request processed by the filter consumes a single token. If the token is available, the request will be allowed. If no tokens are available, the request will receive the configured rate limit status.
HTTP request rate limiting can be configured at the virtual host level by specifying the rate limiting attributes nested under the spec.rateLimit.local.http field. Alternatively, rate limiting can be configured per HTTP route allowed on the upstream backend by specifying the rate limiting attributes as a part of the spec.httpRoutes field. It is important to note that when configuring rate limiting per HTTP route, the route matches an HTTP path that has already been permitted by a service mesh policy, otherwise the rate limiting policy will be ignored.
The following rate limiting attributes can be configured for HTTP traffic:
requests: The number of requests allowed per unit of time before rate limiting occurs on all backends belonging to the upstream host specified via thespec.hostfield in theUpstreamTrafficSettingconfiguration.unit: The period of time within which requests over the limit will be rate limited. Valid values aresecond,minuteandhour.burst: The number of requests above the baseline rate that are allowed in a short period of time.responseStatusCode: The HTTP status code to use for responses to rate limited requests. Code must be in the 400-599 (inclusive) error range. If not specified, a default of 429 (Too Many Requests) is used.responseHeadersToAdd: The list of HTTP headers as key-value pairs that should be added to each response for requests that have been rate limited.
Demos
To learn more about configuring rate limting, refer to the following demo guides:
3.7 - Ingress
3.7.1 - Ingress to Mesh
Using Ingress to manage external access to services within the cluster
Ingress refers to managing external access to services within the cluster, typically HTTP/HTTPS services. FSM’s ingress capability allows cluster administrators and application owners to route traffic from clients external to the service mesh to service mesh backends using a set of rules depending on the mechanism used to perform ingress.
IngressBackend API
FSM leverages its IngressBackend API to configure a backend service to accept ingress traffic from trusted sources. The specification enables configuring how specific backends must authorize ingress traffic depending on the protocol used, HTTP or HTTPS. When the backend protocol is http, the specified source kind must either be: 1. Service kind whose endpoints will be authorized to connect to the backend, or 2. IPRange kind that specifies the source IP CIDR range authorized to connect to the backend. When the backend protocol is https, the source specified must be an AuthenticatedPrincipal kind which defines the Subject Alternative Name (SAN) encoded in the client’s certificate that the backend will authenticate. A source with the kind Service or IPRange is optional for https backends, and if specified implies that the client must match the source in addition to its AuthenticatedPrincipal value. For https backends, client certificate validation is performed by default and can be disabled by setting skipClientCertValidation: true in the tls field for the backend. The port.number field for a backend service in the IngressBackend configuration must correspond to the targetPort of a Kubernetes service.
Note that when the Kind for a source in an IngressBackend configuration is set to Service, FSM controller will attempt to discover the endpoints of that service. For FSM to be able to discover the endpoints of a service, the namespace in which the service resides needs to be a monitored namespace. Enable the namespace to be monitored using:
kubectl label ns <namespace> flomesh.io/monitored-by=<mesh name>
Examples
The following IngressBackend configuration will allow access to the foo service on port 80 in the test namespace only if the source originating the traffic is an endpoint of the myapp service in the default namespace:
kind: IngressBackend
apiVersion: policy.flomesh.io/v1alpha1
metadata:
  name: basic
  namespace: test
spec:
  backends:
    - name: foo
      port:
        number: 80 # targetPort of the service
        protocol: http
  sources:
    - kind: Service
      namespace: default
      name: myapp
The following IngressBackend configuration will allow access to the foo service on port 80 in the test namespace only if the source originating the traffic has an IP address that belongs to the CIDR range 10.0.0.0/8:
kind: IngressBackend
apiVersion: policy.flomesh.io/v1alpha1
metadata:
  name: basic
  namespace: test
spec:
  backends:
    - name: foo
      port:
        number: 80 # targetPort of the service
        protocol: http
  sources:
    - kind: IPRange
      name: 10.0.0.0/8
The following IngressBackend configuration will allow access to the foo service on port 80 in the test namespace only if the source originating the traffic encrypts the traffic with TLS and has the Subject Alternative Name (SAN) client.default.svc.cluster.local encoded in its client certificate:
kind: IngressBackend
apiVersion: policy.flomesh.io/v1alpha1
metadata:
  name: basic
  namespace: test
spec:
  backends:
    - name: foo
      port:
        number: 80
        protocol: https # https implies TLS
      tls:
        skipClientCertValidation: false # mTLS (optional, default: false)
  sources:
    - kind: AuthenticatedPrincipal
      name: client.default.svc.cluster.local
Refer to the following sections to understand how the IngressBackend configuration looks like for http and https backends.
Choices to perform Ingress
FSM supports multiple options to expose mesh services externally using ingress which are described in the following sections. FSM has been tested with Contour and OSS Nginx, which work with the ingress controller installed outside the mesh and provisioned with a certificate to participate in the mesh.
Note: FSM integration with Nginx Plus has not been fully tested for picking up a self-signed mTLS certificate from a Kubernetes secret. However, an alternative way to incorporate Nginx Plus or any ingress is to install it in the mesh so that it is injected with an Pipy sidecar, which will allow it to participate in the mesh. Additional inbound ports such as 80 and 443 may need to be allowed to bypass the Pipy sidecar.
1. Using FSM ingress controllers and gateways
Using FSM ingress controllers and edge proxy is the preferred method for executing Ingress in an FSM managed services mesh. Using FSM, users get a high-performance ingress controller with rich policy specifications for a variety of scenarios, while maintaining lightweight profiles.
To use FSM as an ingress, enable it during mesh installation by passing option --set=fsm.fsmIngress.enabled=true:
fsm install \
    --set=fsm.fsmIngress.enabled=true
Or enable ingress feature after mesh installed:
fsm ingress enable --fsm-namespace <FSM NAMESPACE>
In addition to configuring the edge proxy for FSM using the appropriate API, the service mesh backend in FSM will only accept traffic from authorized edge proxy or gateways. FSM’s IngressBackend specification allows cluster administrators and application owners to explicitly specify how the service mesh backend should authorize ingress traffic. The following sections describe how to use the IngressBackend and HTTPProxy APIs in combination to allow HTTP and HTTPS ingress traffic to be routed to the mesh backend.
It is recommended that ingress traffic always be restricted to authorized clients. To do this, enable FSM to monitor the endpoints of the edge proxy located in the namespace where the ingress installation is located:
kubectl label ns <fsm namespace> flomesh.io/monitored-by=<mesh name>
If using FSM Ingress as Ingress controller, there is no need to execute command above.
HTTP Ingress using FSM
A minimal [HTTPProxy][2] configuration and FSM’s IngressBackend1 specification to route ingress traffic to the mesh service foo in the namespace test might look like the following:
apiVersion: networking.k8s.io/v1
kind: Ingress
metadata:
  name: fsm-ingress
  namespace: test
spec:
  ingressClassName: pipy
  rules:
  - host: foo-basic.bar.com
    http:
      paths:
      - path: /
        pathType: Prefix
        backend:
          service:
            name: foo
            port:
              number: 80
---
kind: IngressBackend
apiVersion: policy.flomesh.io/v1alpha1
metadata:
  name: basic
  namespace: test
spec:
  backends:
    - name: foo
      port:
        number: 80 # targetPort of the service
        protocol: http # http implies no TLS
  sources:
    - kind: Service
      namespace: fsm-system
      name: fsm-ingress
The above configuration allows external clients to access the foo service under the test namespace.
- The Ingress configuration will route incoming HTTP traffic from external sources with the
Host:header offoo-basic.bar.comto the service namedfooon port80in thetestnamespace. - IngressBackend is configured to allow only endpoints named
fsm-ingressservice from the same namespace where FSM is installed (default isfsm-system) to access port80of thefooserivce under thetestnamespace.
Examples
Refer to the Ingress with FSM demo for examples on how to expose mesh services externally using FSM in FSM.
2. Bring your own Ingress Controller and Gateway
If using FSM with FSM for ingress is not feasible for your use case, FSM provides the facility to use your own ingress controller and edge gateway for routing external traffic to service mesh backends. Much like how ingress is configured above, in addition to configuring the ingress controller to route traffic to service mesh backends, an IngressBackend configuration is required to authorize clients responsible for proxying traffic originating externally.
3.7.2 - Service Loadbalancer
3.7.3 - FSM Ingress Controller
The Kubernetes Ingress API is designed with a separation of concerns, where the Ingress implementation provides an entry feature infrastructure managed by operations staff; it also allows application owners to control the routing of requests to the backend through rules.
Ingress is an API object for managing external access to services in a cluster, with typical access through HTTP. It provides load balancing, SSL termination, and name-based virtual hosting. For the Ingress resource to work, the cluster must have a running Ingress controller.
Ingress controller configures the HTTP load balancer by monitoring Ingress resources in the cluster.
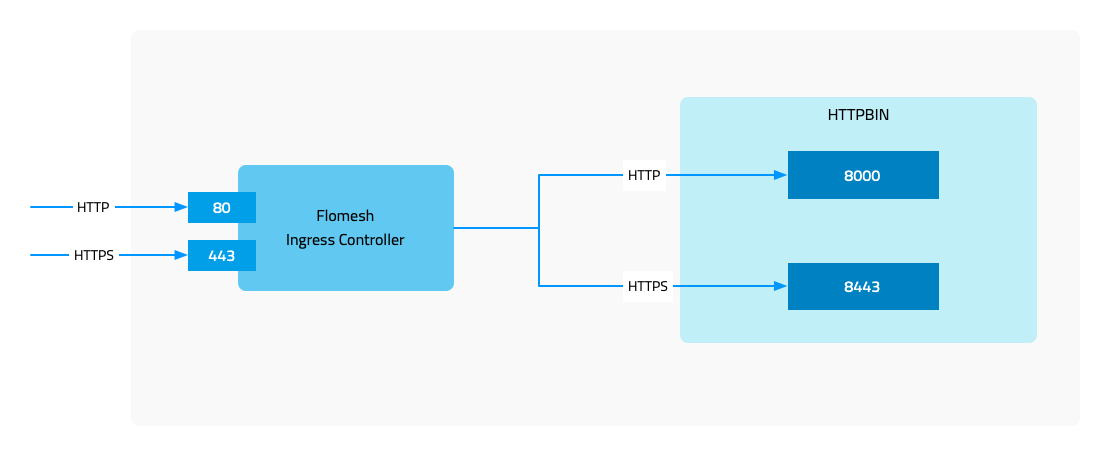
3.7.3.1 - Installation
Installation
Prerequisites
- Kubernetes cluster version v1.19.0 or higher.
- FSM version >= v1.1.0.
- FSM CLI to install FSM and enable FSM Ingress.
There are two options to install FSM Ingress Controller. One is installing it along with FSM during FSM installation. It won’t be enabled by default so we need to enable it explicitly:
fsm install \
    --set=fsm.fsmIngress.enabled=true
Another is installing it separately if you already have FSM mesh installed.
Using the fsm command line tool to enable FSM Ingress Controller.
fsm ingress enable
Check the resource.
kubectl get pod,svc -n fsm-system -l app=fsm-ingress
NAME                               READY   STATUS    RESTARTS   AGE
pod/fsm-ingress-574465b678-xj8l6   1/1     Running   0          14h

NAME                  TYPE           CLUSTER-IP      EXTERNAL-IP   PORT(S)        AGE
service/fsm-ingress   LoadBalancer   10.43.243.124   10.0.2.4      80:30508/TCP   14h
Once all done, we can start to play with FSM Ingress Controller.
3.7.3.3 - Advanced TLS
FSM Ingress Controller - Advanced TLS
In the document of FSM Ingress Controller, we introduced FSM Ingress and some of its basic functinoality. In this part of series, we will continue on where we left and look into advanced TLS features and we can configure FSM Ingress to use them.
Normally, we see below four combinations of communication with upstream services
- Client -> HTTP Ingress -> HTTP Upstream
- Client -> HTTPS Ingress -> HTTP Upstream
- Client -> HTTP Ingress -> HTTPS Upstream
- Client -> HTTPS Ingress -> HTTPS Upstream
Two of the above combinations has been covered in basics introduction blog post and in this article we will introduce the remaining two combinations i.e. communicating with an upstream HTTPS service.
- HTTPS Upstream: The certificate of the backend service, the upstream, must be checked.
- Client Verification: Mainly when using HTTPS entrance, the certificate used by the client is checked.
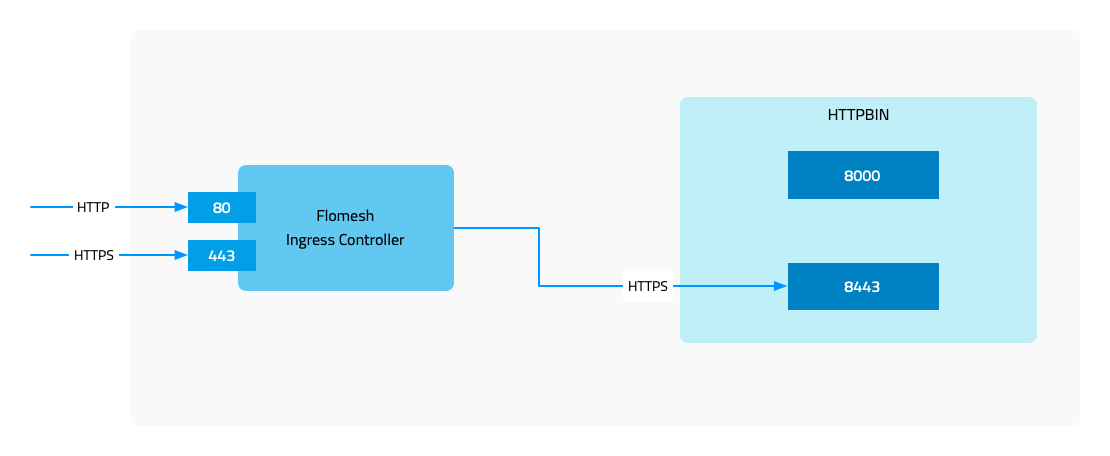
Demo
3.7.3.4 - TLS Passthrough
FSM Ingress Controller - TLS Passthrough
This guide will demonstrate TLS passthrough feature of FSM Ingress.
What is TLS passthrough
TLS (Secure Socket Layer), also known as TLS (Transport Layer Security), protects the security communication between the client and the server through encryption.
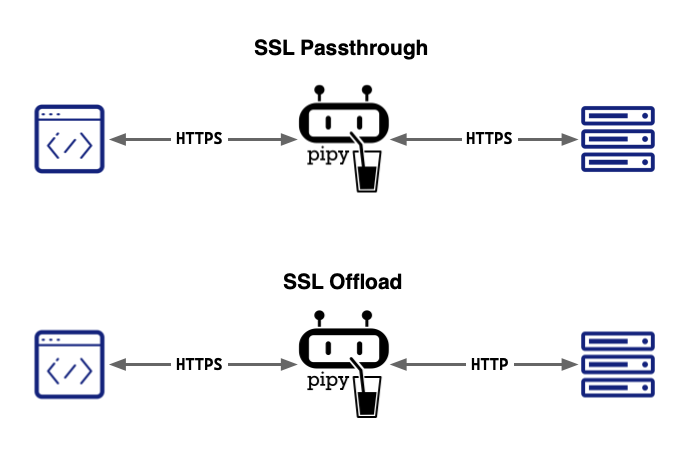
TLS Passthrough is one of the two ways that a proxy server handles TLS requests (the other is TLS offload). In TLS passthrough mode, the proxy does not decrypt the TLS request from the client but instead forwards it to the upstream server for decryption, meaning the data remains encrypted while passing through the proxy, thus ensuring the security of important and sensitive data.
Advantages of TLS passthrough
- Since the data is not decrypted on the proxy but is forwarded to the upstream server in an encrypted manner, the data is protected from network attacks.
- Encrypted data arrives at the upstream server without decryption, ensuring the confidentiality of the data.
- This is also the simplest method of configuring TLS for the proxy.
Disadvantages of TLS passthrough
- Malicious code may be present in the traffic, which will directly reach the backend server.
- In the TLS passthrough process, switching servers is not possible.
- Layer-7 traffic processing cannot be performed.
Installation
The TLS passthrough feature can be enabled during installation of FSM.
fsm install --set=fsm.image.registry=addozhang --set=fsm.image.tag=latest-main --set=fsm.fsmIngress.enabled=true --set=fsm.fsmIngress.tls.enabled=true --set=fsm.fsmIngress.tls.sslPassthrough.enabled=true
Or you can enable it during FSM Ingress enabling when already have FSM installed.
fsm ingress enable --tls-enable --passthrough-enable
Demo
3.7.4 - FSM Gateway
The FSM Gateway serves as an implementation of the Kubernetes Gateway API, representing one of the various components within the FSM world.
Upon activation of the FSM Gateway, the FSM controller, assuming the position of gateway overseer, diligently monitors both Kubernetes native resources and Gateway API assets. Subsequently, it dynamically furnishes the pertinent configurations to Pipy, functioning as a proxy.
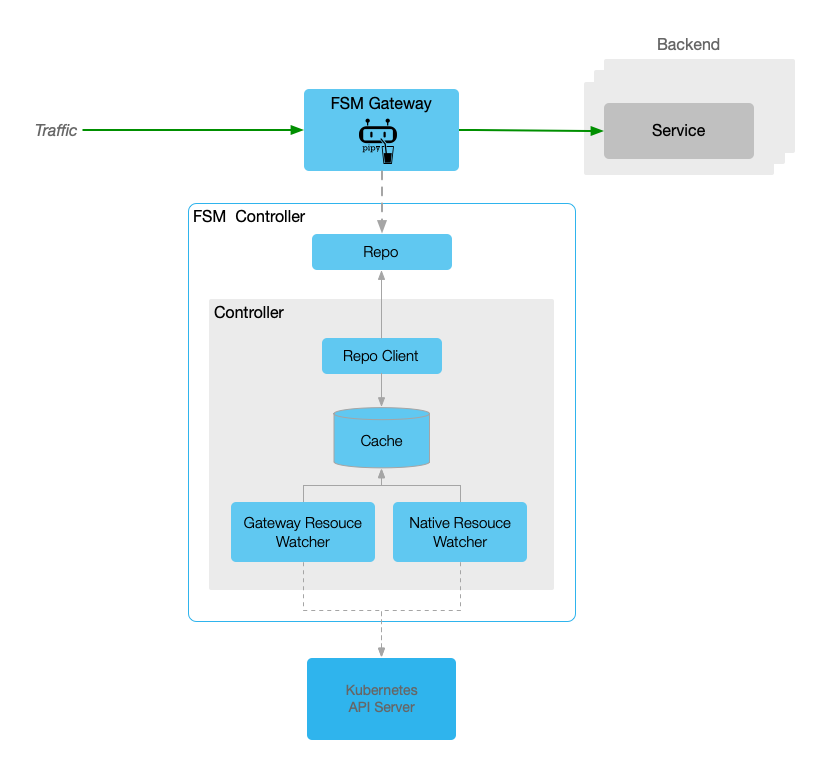
Should you have an interest in the FSM Gateway, the ensuing documentation might prove beneficial.
3.7.4.1 - Installation
To utilize the FSM Gateway, initial activation within the FSM is requisite. Analogous to the FSM Ingress, two distinct methodologies exist for its enablement.
Note: It is imperative to acknowledge that the minimum required version of Kubernetes to facilitate the FSM Gateway activation is v1.21.0.
Let’s start.
Prerequisites
- Kubernetes cluster version v1.21.0 or higher.
- FSM version >= v1.1.0.
- FSM CLI to install FSM and enable FSM Gateway.
Installation
One methodology for enabling FSM Gateway is enable it during FSM installation. Remember that it’s diabled by defaulty.
fsm install \
    --set=fsm.fsmGateway.enabled=true
Another approach is installing it individually if you already have FSM mesh installed.
fsm gateway enable
Once done, we can check the GatewayClass resource in cluster.
kubectl get GatewayClass
NAME              CONTROLLER                      ACCEPTED   AGE
fsm-gateway-cls   flomesh.io/gateway-controller   True       113s
Yes, the fsm-gateway-cls is just the one we are expecting. We can also get the controller name above.
Different from Ingress controller, there is no explicit Deployment or Pod unless create a Gateway manually.
Let’s try with below to create a simple FSM gateway.
Quickstart
To create a FSM gateway, we need to create Gateway resource. This manifest will setup a gateway which will listen on port 8000 and accept the xRoute resources from same namespace.
xRoutestands forHTTPRoute,HTTPRoute,TLSRoute,TCPRoute,UDPRouteandGRPCRoute.
kubectl apply -n fsm-system -f - <<EOF
apiVersion: gateway.networking.k8s.io/v1
kind: Gateway
metadata:
  name: simple-fsm-gateway
spec:
  gatewayClassName: fsm-gateway-cls
  listeners:
    - protocol: HTTP
      port: 8000
      name: http
      allowedRoutes:
        namespaces:
          from: Same
EOF
Then we can check the resoureces:
kubectl get po,svc -n fsm-system -l app=fsm-gateway
NAME                                          READY   STATUS    RESTARTS   AGE
pod/fsm-gateway-fsm-system-745ddc856b-v64ql   1/1     Running   0          12m

NAME                             TYPE           CLUSTER-IP     EXTERNAL-IP   PORT(S)          AGE
service/fsm-gateway-fsm-system   LoadBalancer   10.43.20.139   10.0.2.4      8000:32328/TCP   12m
At this time, you will get result below if trying to access the gateway port:
curl -i 10.0.2.4:8000/
HTTP/1.1 404 Not Found
content-length: 13
connection: keep-alive

Not found
That’s why we have not configure any route. Let’s create a HTTRoute for the Service fsm-controller(The FSM controller has a Pipy repo running).
kubectl apply -n fsm-system -f - <<EOF
apiVersion: gateway.networking.k8s.io/v1
kind: HTTPRoute
metadata:
  name: repo
spec:
  parentRefs:
  - name: simple-fsm-gateway
    port: 8000
  rules:
  - backendRefs:
    - name: fsm-controller
      port: 6060
EOF
Trigger the request again, it responds 200 this time.
curl -i 10.0.2.4:8000/
HTTP/1.1 200 OK
content-type: text/html
content-length: 0
connection: keep-alive
3.7.4.2 - HTTP Routing
In FSM Gateway, the HTTPRoute resource is used to configure route rules which will match request to backend servers. Currently, the Kubernetes Service is the only one accepted as backend resource.
Prerequisites
- Kubernetes cluster version v1.21.0 or higher.
- kubectl CLI
- FSM Gateway installed via guide doc.
Demonstration
Deploy sample
First, let’s install the example in namespace httpbin with commands below.
kubectl create namespace httpbin
kubectl apply -n httpbin -f https://raw.githubusercontent.com/flomesh-io/fsm-docs/main/manifests/gateway/http-routing.yaml
Verification
Once done, we can get the gateway installed.
kubectl get pod,svc -n httpbin -l app=fsm-gateway default ⎈
NAME READY STATUS RESTARTS AGE
pod/fsm-gateway-httpbin-867768f76c-69s6x 1/1 Running 0 16m
NAME TYPE CLUSTER-IP EXTERNAL-IP PORT(S) AGE
service/fsm-gateway-httpbin LoadBalancer 10.43.41.36 10.0.2.4 8000:31878/TCP 16m
Beyond the gateway resources, we also create the HTTPRoute resources.
kubectl get httproute -n httpbin
NAME             HOSTNAMES             AGE
http-route-foo   ["foo.example.com"]   18m
http-route-bar   ["bar.example.com"]   18m
Testing
To test the rules, we should get the address of gateway first.
export GATEWAY_IP=$(kubectl get svc -n httpbin -l app=fsm-gateway -o jsonpath='{.items[0].status.loadBalancer.ingress[0].ip}')
We can trigger a request to gateway without hostname.
curl -i http://$GATEWAY_IP:8000/headers
HTTP/1.1 404 Not Found
server: pipy-repo
content-length: 0
connection: keep-alive
It responds with 404. Next, we can try with the hostnames configured in HTTPRoute resources.
curl -H 'host:foo.example.com' http://$GATEWAY_IP:8000/headers
{
  "headers": {
    "Accept": "*/*",
    "Connection": "keep-alive",
    "Host": "foo.example.com",
    "User-Agent": "curl/7.68.0"
  }
}

curl -H 'host:bar.example.com' http://$GATEWAY_IP:8000/headers
{
  "headers": {
    "Accept": "*/*",
    "Connection": "keep-alive",
    "Host": "bar.example.com",
    "User-Agent": "curl/7.68.0"
  }
}
This time, the server responds success message. There is hostname we are requesting in each response.
3.7.4.3 - HTTP URL Rewrite
The URL rewriting feature provides FSM Gateway users with a way to modify the request URL before the traffic enters the target service. This not only provides greater flexibility to adapt to changes in backend services, but also ensures smooth migration of applications and normalization of URLs.
The HTTPRoute resource utilizes HTTPURLRewriteFilter to rewrite the path in request to another one before it gets forwarded to upstream.
Prerequisites
- Kubernetes cluster version v1.21.0 or higher.
- kubectl CLI
- FSM Gateway installed via guide doc.
Demonstration
We will follow the sample in HTTP Routing.
In backend server, there is a path /get which will responds more information than path /headers.
curl -H 'host:foo.example.com' http://$GATEWAY_IP:8000/get
{
  "args": {},
  "headers": {
    "Accept": "*/*",
    "Connection": "keep-alive",
    "Host": "foo.example.com",
    "User-Agent": "curl/7.68.0"
  },
  "origin": "10.42.0.87",
  "url": "http://foo.example.com/get"
}
Replace URL Full Path
Example bellow will replace the /get path to /headers path.
kubectl apply -n httpbin -f - <<EOF
apiVersion: gateway.networking.k8s.io/v1
kind: HTTPRoute
metadata:
  name: http-route-foo
spec:
  parentRefs:
  - name: simple-fsm-gateway
    port: 8000
  hostnames:
  - foo.example.com
  rules:
  - matches:
    - path:
        type: PathPrefix
        value: /get
    filters:
    - type: URLRewrite
      urlRewrite:
        path:
          type: ReplaceFullPath
          replaceFullPath: /headers
    backendRefs:
    - name: httpbin
      port: 8080
  - matches:
    - path:
        type: PathPrefix
        value: /
    backendRefs:
    - name: httpbin
      port: 8080
EOF
After updated the HTTP rule, we will get the same response as /headers when requesting /get.
curl -H 'host:foo.example.com' http://$GATEWAY_IP:8000/get
{
  "headers": {
    "Accept": "*/*",
    "Connection": "keep-alive",
    "Host": "foo.example.com",
    "User-Agent": "curl/7.68.0"
  }
}
Replace URL Prefix Path
In backend server, there is another two paths:
/status/{statusCode}will respond with specified status code./stream/{n}will respond the response of/getntimes in stream.
curl -s -w "%{response_code}\n" -H 'host:foo.example.com' http://$GATEWAY_IP:8000/status/204
204
curl -s -H 'host:foo.example.com' http://$GATEWAY_IP:8000/stream/1
{"url": "http://foo.example.com/stream/1", "args": {}, "headers": {"Host": "foo.example.com", "User-Agent": "curl/7.68.0", "Accept": "*/*", "Connection": "keep-alive"}, "origin": "10.42.0.161", "id": 0}
If we hope to change the behavior of /status to /stream, the rule is required to update again.
kubectl apply -n httpbin -f - <<EOF
apiVersion: gateway.networking.k8s.io/v1
kind: HTTPRoute
metadata:
  name: http-route-foo
spec:
  parentRefs:
  - name: simple-fsm-gateway
    port: 8000
  hostnames:
  - foo.example.com
  rules:
  - matches:
    - path:
        type: PathPrefix
        value: /status
    filters:
    - type: URLRewrite
      urlRewrite:
        path:
          type: ReplacePrefixMatch
          replacePrefixMatch: /stream
    backendRefs:
    - name: httpbin
      port: 8080
  - matches:
    - path:
        type: PathPrefix
        value: /
    backendRefs:
    - name: httpbin
      port: 8080
EOF
If we trigger the request to /status/204 path again, we will stream the request data 204 times.
curl -s -H 'host:foo.example.com' http://$GATEWAY_IP:8000/status/204
{"url": "http://foo.example.com/stream/204", "args": {}, "headers": {"Host": "foo.example.com", "User-Agent": "curl/7.68.0", "Accept": "*/*", "Connection": "keep-alive"}, "origin": "10.42.0.161", "id": 99}
...
Replace Host Name
Let’s follow the example rule below. It will replace host name from foo.example.com to baz.example.com for all traffic requesting /get.
kubectl apply -n httpbin -f - <<EOF
apiVersion: gateway.networking.k8s.io/v1
kind: HTTPRoute
metadata:
  name: http-route-foo
spec:
  parentRefs:
  - name: simple-fsm-gateway
    port: 8000
  hostnames:
  - foo.example.com
  rules:
  - matches:
    - path:
        type: PathPrefix
        value: /get
    filters:
    - type: URLRewrite
      urlRewrite:
        hostname: baz.example.com
    backendRefs:
    - name: httpbin
      port: 8080
  - matches:
    - path:
        type: PathPrefix
        value: /
    backendRefs:
    - name: httpbin
      port: 8080
EOF
Update rule and trigger request. We can see the client is requesting url http://foo.example.com/get, but the Host is replaced.
curl -H 'host:foo.example.com' http://$GATEWAY_IP:8000/get
{
  "args": {},
  "headers": {
    "Accept": "*/*",
    "Connection": "keep-alive",
    "Host": "baz.example.com",
    "User-Agent": "curl/7.68.0"
  },
  "origin": "10.42.0.87",
  "url": "http://baz.example.com/get"
3.7.4.4 - HTTP Redirect
Request redirection is a common network application function that allows the server to tell the client: “The resource you requested has been moved to another location, please go to the new location to obtain it.”
The HTTPRoute resource utilizes HTTPRequestRedirectFilter to redirect client to the specified new location.
Prerequisites
- Kubernetes cluster version v1.21.0 or higher.
- kubectl CLI
- FSM Gateway installed via guide doc.
Demonstration
We will follow the sample in HTTP Routing.
In our backend server, there are two paths /headers and /get. The previous one responds all request headers as body, and the latter one responds more information of client than /headers.
To facilitate testing, it’s better to add records to local hosts.
echo $GATEWAY_IP foo.example.com bar.example.com >> /etc/hosts
-bash: /etc/hosts: Permission denied
curl foo.example.com/headers
{
  "headers": {
    "Accept": "*/*",
    "Connection": "keep-alive",
    "Host": "foo.example.com",
    "User-Agent": "curl/7.68.0"
  }
}
curl bar.example.com/get
{
  "args": {},
  "headers": {
    "Accept": "*/*",
    "Connection": "keep-alive",
    "Host": "bar.example.com",
    "User-Agent": "curl/7.68.0"
  },
  "origin": "10.42.0.87",
  "url": "http://bar.example.com/get"
}
Host Name Redirect
The HTTP status code 3XX are used to redirect client to another address. We can redirect all requests to foo.example.com to bar.example.com by responding 301 status and new hostname.
apiVersion: gateway.networking.k8s.io/v1
kind: HTTPRoute
metadata:
  name: http-route-foo
spec:
  parentRefs:
  - name: simple-fsm-gateway
    port: 8000
  hostnames:
  - foo.example.com
  rules:
  - matches:
    - path:
        type: PathPrefix
        value: /
    filters:
    - type: RequestRedirect
      requestRedirect:
        hostname: bar.example.com
        port: 8000
        statusCode: 301
    backendRefs:
    - name: httpbin
      port: 8080
Now, it will return the 301 code and bar.example.com:8000 when requesting foo.example.com.
curl -i http://foo.example.com:8000/get
HTTP/1.1 301 Moved Permanently
Location: http://bar.example.com:8000/get
content-length: 0
connection: keep-alive
By default, curl does not follow location redirecting unless enable it by assign opiton -L.
curl -L http://foo.example.com:8000/get
{
  "args": {},
  "headers": {
    "Accept": "*/*",
    "Connection": "keep-alive",
    "Host": "bar.example.com:8000",
    "User-Agent": "curl/7.68.0"
  },
  "origin": "10.42.0.161",
  "url": "http://bar.example.com:8000/get"
}
Prefix Path Redirect
With path redirection, we can implement what we did with URL Rewriting: redirect the request to /status/{n} to /stream/{n}.
apiVersion: gateway.networking.k8s.io/v1
kind: HTTPRoute
metadata:
  name: http-route-foo
spec:
  parentRefs:
  - name: simple-fsm-gateway
    port: 8000
  hostnames:
  - foo.example.com
  rules:
  - matches:
    - path:
        type: PathPrefix
        value: /status
    filters:
    - type: RequestRedirect
      requestRedirect:
        path:
          type: ReplacePrefixMatch
          replacePrefixMatch: /stream
        statusCode: 301
    backendRefs:
    - name: httpbin
      port: 8080
  - matches:
    backendRefs:
    - name: httpbin
      port: 8080
After update rull, we will get.
curl -i http://foo.example.com:8000/status/204
HTTP/1.1 301 Moved Permanently
Location: http://foo.example.com:8000/stream/204
content-length: 0
connection: keep-alive
Full Path Redirect
We can also change full path during redirecting, such as redirect all /status/xxx to /status/200.
apiVersion: gateway.networking.k8s.io/v1
kind: HTTPRoute
metadata:
  name: http-route-foo
spec:
  parentRefs:
  - name: simple-fsm-gateway
    port: 8000
  hostnames:
  - foo.example.com
  rules:
  - matches:
    - path:
        type: PathPrefix
        value: /status
    filters:
    - type: RequestRedirect
      requestRedirect:
        path:
          type: ReplaceFullPath
          replaceFullPath: /status/200
        statusCode: 301
    backendRefs:
    - name: httpbin
      port: 8080
  - matches:
    backendRefs:
    - name: httpbin
      port: 8080
Now, the status of requests to /status/xxx will be redirected to /status/200.
curl -i http://foo.example.com:8000/status/204
HTTP/1.1 301 Moved Permanently
Location: http://foo.example.com:8000/status/200
content-length: 0
connection: keep-alive
3.7.4.5 - HTTP Request Header Manipulate
The HTTP header manipulation feature allows you to fine-tune incoming and outgoing request and response headers.
In Gateway API, the HTTPRoute resource utilities two HTTPHeaderFilter filter for request and response header manipulation.
The both filters supports add, set and remove operation. The combination of them is also available.
This document will introduce the HTTP request header manipulation function of FSM Gateway. The introduction of HTTP response header manipulation is located in doc HTTP Response Header Manipulate.
Prerequisites
- Kubernetes cluster version v1.21.0 or higher.
- kubectl CLI
- FSM Gateway installed via guide doc.
Demonstration
We will follow the sample in HTTP Routing.
In backend service, there is a path /headers which will respond all request headers.
curl -H 'host:foo.example.com' http://$GATEWAY_IP:8000/headers
{
  "headers": {
    "Accept": "*/*",
    "Connection": "keep-alive",
    "Host": "10.42.0.15:80",
    "User-Agent": "curl/8.1.2"
  }
}
Add HTTP Request header
With header adding feature, let’s try to add a new header to request by add HTTPHeaderFilter filter.
Modifying the HTTPRoute http-route-foo and add RequestHeaderModifier filter.
kubectl apply -n httpbin -f - <<EOF
apiVersion: gateway.networking.k8s.io/v1
kind: HTTPRoute
metadata:
  name: http-route-foo
spec:
  parentRefs:
  - name: simple-fsm-gateway
    port: 8000
  hostnames:
  - foo.example.com
  rules:
  - matches:
    - path:
        type: PathPrefix
        value: /
    backendRefs:
    - name: httpbin
      port: 8080
    filters:
    - type: RequestHeaderModifier
      requestHeaderModifier:
        add:
        - name: "header-2-add"
          value: "foo"
EOF
Now request the path /headers again and you will get the new header injected by gateway.
Thought HTTP header name is case insensitive but it will be converted to capital mode.
curl -H 'host:foo.example.com' http://$GATEWAY_IP:8000/headers
{
  "headers": {
    "Accept": "*/*",
    "Connection": "keep-alive",
    "Header-2-Add": "foo",
    "Host": "10.42.0.15:80",
    "User-Agent": "curl/8.1.2"
  }
}
Set HTTP Request header
set operation is used to update the value of specified header. If the header not exist, it will do as add operation.
Let’s update the HTTPRoute resource again and set two headers with new value. One does not exist and another does.
kubectl apply -n httpbin -f - <<EOF
apiVersion: gateway.networking.k8s.io/v1
kind: HTTPRoute
metadata:
  name: http-route-foo
spec:
  parentRefs:
  - name: simple-fsm-gateway
    port: 8000
  hostnames:
  - foo.example.com
  rules:
  - matches:
    - path:
        type: PathPrefix
        value: /
    backendRefs:
    - name: httpbin
      port: 8080
    filters:
    - type: RequestHeaderModifier
      requestHeaderModifier:
        set:
        - name: "header-2-set"
          value: "foo"
        - name: "user-agent"
          value: "Mozilla/5.0 (Macintosh; Intel Mac OS X 10_15_7) AppleWebKit/605.1.15 (KHTML, like Gecko) Version/17.0 Safari/605.1.15"
EOF
In the response, we can get the two headers updated.
curl -H 'host:foo.example.com' http://$GATEWAY_IP:8000/headers
{
  "headers": {
    "Accept": "*/*",
    "Connection": "keep-alive",
    "Header-2-Set": "foo",
    "Host": "10.42.0.15:80",
    "User-Agent": "Mozilla/5.0 (Macintosh; Intel Mac OS X 10_15_7) AppleWebKit/605.1.15 (KHTML, like Gecko) Version/17.0 Safari/605.1.15"
  }
}
Remove HTTP Request header
The last operation is remove, which can remove the header of client sending.
Let’s update the HTTPRoute resource to remove user-agent header directly to hide client type from backend service.
kubectl apply -n httpbin -f - <<EOF
apiVersion: gateway.networking.k8s.io/v1
kind: HTTPRoute
metadata:
  name: http-route-foo
spec:
  parentRefs:
  - name: simple-fsm-gateway
    port: 8000
  hostnames:
  - foo.example.com
  rules:
  - matches:
    - path:
        type: PathPrefix
        value: /
    backendRefs:
    - name: httpbin
      port: 8080
    filters:
    - type: RequestHeaderModifier
      requestHeaderModifier:
        remove:
        - "user-agent"
EOF
With resource udpated, the user agent is invisible on backend service side.
curl -H 'host:foo.example.com' http://$GATEWAY_IP:8000/headers
{
  "headers": {
    "Accept": "*/*",
    "Connection": "keep-alive",
    "Host": "10.42.0.15:80"
  }
}
3.7.4.6 - HTTP Response Header Manipulate
The HTTP header manipulation feature allows you to fine-tune incoming and outgoing request and response headers.
In Gateway API, the HTTPRoute resource utilities two HTTPHeaderFilter filter for request and response header manipulation.
The both filters supports add, set and remove operation. The combination of them is also available.
This document will introduce the HTTP response header manipulation function of FSM Gateway. The introduction of HTTP request header manipulation is located in doc HTTP Request Header Manipulate.
Prerequisites
- Kubernetes cluster version v1.21.0 or higher.
- kubectl CLI
- FSM Gateway installed via guide doc.
Demonstration
We will follow the sample in HTTP Routing.
In backend service responds the generated headers as below.=
curl -I -H 'host:foo.example.com' http://$GATEWAY_IP:8000/headers
HTTP/1.1 200 OK
server: gunicorn/19.9.0
date: Tue, 21 Nov 2023 08:54:43 GMT
content-type: application/json
content-length: 106
access-control-allow-origin: *
access-control-allow-credentials: true
connection: keep-alive
Add HTTP Response header
With header adding feature, let’s try to add a new header to response by add HTTPHeaderFilter filter.
Modifying the HTTPRoute http-route-foo and add ResponseHeaderModifier filter.
kubectl apply -n httpbin -f - <<EOF
apiVersion: gateway.networking.k8s.io/v1
kind: HTTPRoute
metadata:
  name: http-route-foo
spec:
  parentRefs:
  - name: simple-fsm-gateway
    port: 8000
  hostnames:
  - foo.example.com
  rules:
  - matches:
    - path:
        type: PathPrefix
        value: /
    backendRefs:
    - name: httpbin
      port: 8080
    filters:
    - type: ResponseHeaderModifier
      responseHeaderModifier:
        add:
        - name: "header-2-add"
          value: "foo"
EOF
Now request the path /headers again and you will get the new header in response injected by gateway.
curl -I -H 'host:foo.example.com' http://$GATEWAY_IP:8000/headers
HTTP/1.1 200 OK
server: gunicorn/19.9.0
date: Tue, 21 Nov 2023 08:56:58 GMT
content-type: application/json
content-length: 139
access-control-allow-origin: *
access-control-allow-credentials: true
header-2-add: foo
connection: keep-alive
Set HTTP Response header
set operation is used to update the value of specified header. If the header not exist, it will do as add operation.
Let’s update the HTTPRoute resource again and set two headers with new value. One does not exist and another does.
kubectl apply -n httpbin -f - <<EOF
apiVersion: gateway.networking.k8s.io/v1
kind: HTTPRoute
metadata:
  name: http-route-foo
spec:
  parentRefs:
  - name: simple-fsm-gateway
    port: 8000
  hostnames:
  - foo.example.com
  rules:
  - matches:
    - path:
        type: PathPrefix
        value: /
    backendRefs:
    - name: httpbin
      port: 8080
    filters:
    - type: ResponseHeaderModifier
      responseHeaderModifier:
        set:
        - name: "header-2-set"
          value: "foo"
        - name: "server"
          value: "fsm/gateway"
EOF
In the response, we can get the two headers updated.
curl -I -H 'host:foo.example.com' http://$GATEWAY_IP:8000/headers
HTTP/1.1 200 OK
server: fsm/gateway
date: Tue, 21 Nov 2023 08:58:56 GMT
content-type: application/json
content-length: 139
access-control-allow-origin: *
access-control-allow-credentials: true
header-2-set: foo
connection: keep-alive
Remove HTTP Response header
The last operation is remove, which can remove the header of client sending.
Let’s update the HTTPRoute resource to remove server header directly to hide backend implementation from client.
kubectl apply -n httpbin -f - <<EOF
apiVersion: gateway.networking.k8s.io/v1
kind: HTTPRoute
metadata:
  name: http-route-foo
spec:
  parentRefs:
  - name: simple-fsm-gateway
    port: 8000
  hostnames:
  - foo.example.com
  rules:
  - matches:
    - path:
        type: PathPrefix
        value: /
    backendRefs:
    - name: httpbin
      port: 8080
    filters:
    - type: ResponseHeaderModifier
      responseHeaderModifier:
        remove:
        - "server"
EOF
With resource udpated, the backend server implementation is invisible on client side.
curl -I -H 'host:foo.example.com' http://$GATEWAY_IP:8000/headers
HTTP/1.1 200 OK
date: Tue, 21 Nov 2023 09:00:32 GMT
content-type: application/json
content-length: 139
access-control-allow-origin: *
access-control-allow-credentials: true
connection: keep-alive
3.7.4.7 - TCP Routing
This document will describe how to configure FSM Gateway to load balance TCP traffic.
During the L4 load balancing process, FSM Gateway determines which backend server to distribute traffic to based mainly on network layer and transport layer information, such as IP address and port number. This approach allows the FSM Gateway to make decisions quickly and forward traffic to the appropriate server, thereby improving overall network performance.
If you want to load balance HTTP traffic, please refer to the document HTTP Routing.
Prerequisites
- Kubernetes cluster version v1.21.0 or higher.
- kubectl CLI
- FSM Gateway installed via guide doc.
Demonstration
Deploy sample
First, let’s install the example in namespace httpbin with commands below.
kubectl create namespace httpbin
kubectl apply -n httpbin -f https://raw.githubusercontent.com/flomesh-io/fsm-docs/main/manifests/gateway/tcp-routing.yaml
The command above will create Gateway and TCPRoute resources except for sample app ht tpbin.
In Gateway, there are two listener defined listening on ports 8000 and 8001.
listeners:
- protocol: TCP
  port: 8000
  name: foo
  allowedRoutes:
    namespaces:
      from: Same
- protocol: TCP
  port: 8001
  name: bar
  allowedRoutes:
    namespaces:
      from: Same
The TCPRoute mapping to backend service httpbin is bound to the two ports defined above.
parentRefs:
- name: simple-fsm-gateway
  port: 8000
- name: simple-fsm-gateway
  port: 8001
rules:
- backendRefs:
  - name: httpbin
    port: 8080
This means we should reach backend service via either of two ports.
Testing
Let’s record the IP address of Gateway first.
export GATEWAY_IP=$(kubectl get svc -n httpbin -l app=fsm-gateway -o jsonpath='{.items[0].status.loadBalancer.ingress[0].ip}')
Sending a request to port 8000 of gateway and it will forward the traffic to backend service.
curl http://$GATEWAY_IP:8000/headers
{
  "headers": {
    "Accept": "*/*",
    "Host": "20.24.88.85:8000",
    "User-Agent": "curl/8.1.2"
  }
With gatweay port 8081, it works fine too.
curl http://$GATEWAY_IP:8001/headers
{
  "headers": {
    "Accept": "*/*",
    "Host": "20.24.88.85:8001",
    "User-Agent": "curl/8.1.2"
  }
}
The path /headers responds all request header received. From the header Host, we can get the entrance.
3.7.4.8 - TLS Termination
TLS offloading is the process of terminating TLS connections at a load balancer or gateway, decrypting the traffic and passing it to the backend server, thereby relieving the backend server of the encryption and decryption burden.
This doc will show you how to use TSL termination for service.
Prerequisites
- Kubernetes cluster version v1.21.0 or higher.
- kubectl CLI
- FSM Gateway installed via guide doc.
Demonstration
export GATEWAY_IP=$(kubectl get svc -n httpbin -l app=fsm-gateway -o jsonpath='{.items[0].status.loadBalancer.ingress[0].ip}')
Issue TLS certificate
If configure TLS, a certificate is required. Let’s issue a certificate first.
openssl req -x509 -sha256 -nodes -days 365 -newkey rsa:2048 \
  -keyout example.com.key -out example.com.crt \
  -subj "/CN=example.com"
With command above executed, you will get two files example.com.crt and example.com.key which we can create a secret with.
kubectl create namespace httpbin
kubectl create secret tls simple-gateway-cert --key=example.com.key --cert=example.com.crt -n httpbin
Deploy sample app
kubectl apply -n httpbin -f https://raw.githubusercontent.com/flomesh-io/fsm-docs/main/manifests/gateway/tls-termination.yaml
Test
curl --cacert example.com.crt https://example.com/headers  --connect-to example.com:443:$GATEWAY_IP:8000
{
  "headers": {
    "Accept": "*/*",
    "Connection": "keep-alive",
    "Host": "example.com",
    "User-Agent": "curl/7.68.0"
  }
}
3.7.4.9 - TLS Passthrough
TLS passthrough means that the gateway does not decrypt TLS traffic, but directly transmits the encrypted data to the back-end server, which decrypts and processes it.
This doc will guide how to use the TLS Passthrought feature.
Prerequisites
- Kubernetes cluster version v1.21.0 or higher.
- kubectl CLI
- FSM Gateway installed via guide doc.
Demonstration
We will utilize https://httpbin.org for TLS passthrough testing, functioning similarly to the sample app deployed in other documentation sections.
Create Gateway
First of all, we need to create a gateway to accept incoming request. Different from TLS Termination, the mode is set to Passthrough for the listener.
Let’s create it in namespace httpbin which accepts route resources in same namespace.
kubectl create ns httpbin
kubectl apply -n httpbin -f - <<EOF
apiVersion: gateway.networking.k8s.io/v1
kind: Gateway
metadata:
  name: simple-fsm-gateway
spec:
  gatewayClassName: fsm-gateway-cls
  listeners:
  - protocol: TLS
    port: 8000
    name: foo
    tls:
      mode: Passthrough
    allowedRoutes:
      namespaces:
        from: Same
EOF
Let’s record the IP address of gateway.
export GATEWAY_IP=$(kubectl get svc -n httpbin -l app=fsm-gateway -o jsonpath='{.items[0].status.loadBalancer.ingress[0].ip}')
Create TCP Route
To route encrypted traffic to a backend service without decryption, the use of TLSRoute is necessary in this context.
In the rules.backendRefs configuration, we specify an external service using its host and port. For example, for https://httpbin.org, these would be set as name: httpbin.org and port: 443.
kubectl apply -n httpbin -f - <<EOF
apiVersion: gateway.networking.k8s.io/v1alpha2
kind: TLSRoute
metadata:
  name: tcp-route
spec:
  parentRefs:
  - name: simple-fsm-gateway
    port: 8000
  rules:
  - backendRefs:
    - name: httpbin.org
      port: 443
EOF
Test
We issue requests to the URL https://httpbin.org, but in reality, these are routed through the gateway.
curl https://httpbin.org/headers --connect-to httpbin.org:443:$GATEWAY_IP:8000
{
  "headers": {
    "Accept": "*/*",
    "Host": "httpbin.org",
    "User-Agent": "curl/8.1.2",
    "X-Amzn-Trace-Id": "Root=1-655dd2be-583e963f5022e1004257d331"
  }
}
3.7.4.10 - gRPC Routing
The GRPCRoute is used to route gRPC request to backend service. It can match requests by hostname, gRPC service, gRPC method, or HTTP/2 header.
Prerequisites
- Kubernetes cluster version v1.21.0 or higher.
- kubectl CLI
- FSM Gateway installed via guide doc.
Demonstration
Deploy sample
kubectl create namespace grpcbin
kubectl apply -n grpcbin -f https://raw.githubusercontent.com/flomesh-io/fsm-docs/main/manifests/gateway/gprc-routing.yaml
In gRPC case, the listener configuration is similar with HTTP routing.
gRPC Route
We configure the match rule using service: hello.HelloService and method: SayHello to direct traffic to the target service.
rules:
- matches:
  - method:
      service: hello.HelloService
      method: SayHello
  backendRefs:
  - name: grpcbin
    port: 9000
Let’s test our configuration now.
Test
To test gRPC service, we will test with help of the tool grpcurl.
Let’s record the IP address of gateway first.
export GATEWAY_IP=$(kubectl get svc -n grpcbin -l app=fsm-gateway -o jsonpath='{.items[0].status.loadBalancer.ingress[0].ip}')
Issue a request using the grpcurl command, specifying the service name and method. Doing so will yield the correct response.
grpcurl -plaintext -d '{"greeting":"Flomesh"}' $GATEWAY_IP:8000 hello.HelloService/SayHello
{
  "reply": "hello Flomesh"
}
3.7.4.11 - UDP Routing
The UDPRoute provides a method to route UDP traffic. When combined with a gateway listener, it can be used to forward traffic on a port specified by the listener to a set of backends defined in the UDPRoute.
Prerequisites
- Kubernetes cluster version v1.21.0 or higher.
- kubectl CLI
- FSM Gateway installed via guide doc.
Demonstration
Prerequisites
- Kubernetes cluster
- kubectl tool
Environment Setup
Deploying Sample Application
Use fortio server as a sample application, which provides a UDP service listening on port 8078 and echoes back the content sent by the client.
kubectl create namespace server
kubectl apply -n server -f - <<EOF
apiVersion: v1
kind: Service
metadata:
  name: fortio
  labels:
    app: fortio
    service: fortio
spec:
  ports:
  - port: 8078
    name: udp-8078
  selector:
    app: fortio
---
apiVersion: apps/v1
kind: Deployment
metadata:
  name: fortio
spec:
  replicas: 1
  selector:
    matchLabels:
      app: fortio
  template:
    metadata:
      labels:
        app: fortio
    spec:
      containers:
      - name: fortio
        image: fortio/fortio:latest_release
        imagePullPolicy: Always
        ports:
        - containerPort: 8078
          name: http
EOF
Creating UDP Gateway
Next, create a Gateway for the UDP service, setting the protocol of the listening port to UDP.
kubectl apply -n server -f - <<EOF
apiVersion: gateway.networking.k8s.io/v1
kind: Gateway
metadata:
  namespace: server
  name: simple-fsm-gateway
spec:
  gatewayClassName: fsm-gateway-cls
  listeners:
    - protocol: UDP
      port: 8000
      name: udp
EOF
Creating UDP Route
Similar to the HTTP protocol, to access backend services through the gateway, a UDPRoute needs to be created.
kubectl -n server apply -f - <<EOF
apiVersion: gateway.networking.k8s.io/v1alpha2
kind: UDPRoute
metadata:
  name: udp-route-sample
spec:
  parentRefs:
    - name: simple-fsm-gateway
      namespace: server
      port: 8000
  rules:
  - backendRefs:
    - name: fortio
      port: 8078
EOF
Test accessing the UDP service. After sending the word ‘fsm’, the same word will be received back.
export GATEWAY_IP=$(kubectl get svc -n server -l app=fsm-gateway -o jsonpath='{.items[0].status.loadBalancer.ingress[0].ip}')

echo 'fsm' | nc -4u -w1 $GATEWAY_IP 8000
fsm
3.7.4.12 - Fault Injection
The fault injection feature is a powerful testing mechanism used to enhance the robustness and reliability of microservice architectures. This capability tests a system’s fault tolerance and recovery mechanisms by simulating network-level failures such as delays and error responses. Fault injection mainly includes two types: delayed injection and error injection.
Delay injection simulates network delays or slow service processing by artificially introducing delays during the gateway’s processing of requests. This helps test whether the timeout handling and retry strategies of downstream services are effective, ensuring that the entire system can maintain stable operation when actual delays occur.
Error injection simulates a backend service failure by having the gateway return an error response (such as HTTP 5xx errors). This method can verify the service consumer’s handling of failures, such as whether error handling logic and fault tolerance mechanisms, such as circuit breaker mode, are correctly executed.
FSM Gateway supports these two types of fault injection and provides two types of granular fault injection: domain and routing. Next, we will show you the fault injection of FSM Gateway through a demonstration.
Prerequisites
- Kubernetes cluster version v1.21.0 or higher.
- kubectl CLI
- FSM Gateway installed via guide doc.
Demonstration
Deploy Sample Application
Next, deploy the sample application, use the commonly used httpbin service, and create Gateway and [HTTP Route (HttpRoute)] (https://gateway-api.sigs.k8s.io/api-types/httproute/).
kubectl create namespace httpbin
kubectl apply -n httpbin -f https://raw.githubusercontent.com/flomesh-io/fsm-docs/main/manifests/gateway/http-routing.yaml
Confirm Gateway and HTTPRoute created. You will get two HTTP routes with different domain.
kubectl get gateway,httproute -n httpbin
NAME                                                   CLASS             ADDRESS   PROGRAMMED   AGE
gateway.gateway.networking.k8s.io/simple-fsm-gateway   fsm-gateway-cls             Unknown      3s

NAME                                                 HOSTNAMES             AGE
httproute.gateway.networking.k8s.io/http-route-foo   ["foo.example.com"]   2s
httproute.gateway.networking.k8s.io/http-route-bar   ["bar.example.com"]   2s
Check if you can reach service via gateway.
export GATEWAY_IP=$(kubectl get svc -n httpbin -l app=fsm-gateway -o jsonpath='{.items[0].status.loadBalancer.ingress[0].ip}')

curl http://$GATEWAY_IP:8000/headers -H 'host:foo.example.com'
{
  "headers": {
    "Accept": "*/*",
    "Connection": "keep-alive",
    "Host": "10.42.0.15:80",
    "User-Agent": "curl/7.81.0"
  }
}
Fault Injection Testing
Route-Level Fault Injection
We add a route under the HTTP route foo.example.com with a path prefix /headers to facilitate setting fault injection.
kubectl apply -n httpbin -f - <<EOF
apiVersion: gateway.networking.k8s.io/v1
kind: HTTPRoute
metadata:
  name: http-route-foo
spec:
  parentRefs:
  - name: simple-fsm-gateway
    port: 8000
  hostnames:
  - foo.example.com
  rules:
  - matches:
    - path:
        type: PathPrefix
        value: /headers
    backendRefs:
    - name: httpbin
      port: 8080
  - matches:
    - path:
        type: PathPrefix
        value: /
    backendRefs:
    - name: httpbin
      port: 8080
EOF
When we request the /headers and /get paths, we can get the correct response.
Next, we inject a 404 fault with a 100% probability on the /headers route. For detailed configuration, please refer to FaultInjectionPolicy API Reference.
kubectl apply -n httpbin -f - <<EOF
apiVersion: gateway.flomesh.io/v1alpha1
kind: FaultInjectionPolicy
metadata:
  name: fault-injection
spec:
  targetRef:
    group: gateway.networking.k8s.io
    kind: HTTPRoute
    name: http-route-foo
    namespace: httpbin
  http:
  - match:
      path:
        type: PathPrefix
        value: /headers
    config:
      abort:
        percent: 100
        statusCode: 404
EOF
Now, requesting /headers results in a 404 response.
curl -I http://$GATEWAY_IP:8000/headers -H 'host:foo.example.com'
HTTP/1.1 404 Not Found
content-length: 0
connection: keep-alive
Requesting /get will not be affected.
curl -I http://$GATEWAY_IP:8000/get -H 'host:foo.example.com'
HTTP/1.1 200 OK
server: gunicorn/19.9.0
date: Thu, 14 Dec 2023 14:11:36 GMT
content-type: application/json
content-length: 220
access-control-allow-origin: *
access-control-allow-credentials: true
connection: keep-alive
Domain-Level Fault Injection
kubectl apply -n httpbin -f - <<EOF
apiVersion: gateway.flomesh.io/v1alpha1
kind: FaultInjectionPolicy
metadata:
  name: fault-injection
spec:
  targetRef:
    group: gateway.networking.k8s.io
    kind: HTTPRoute
    name: http-route-foo
    namespace: httpbin
  hostnames:
    - hostname: foo.example.com
      config:
        abort:
          percent: 100
          statusCode: 404
EOF
Requesting foo.example.com returns a 404 response.
curl -I http://$GATEWAY_IP:8000/headers -H 'host:foo.example.com'
HTTP/1.1 404 Not Found
content-length: 0
connection: keep-alive
However, requesting bar.example.com, which is not listed in the fault injection, responds normally.
curl -I http://$GATEWAY_IP:8000/headers -H 'host:bar.example.com'
HTTP/1.1 200 OK
server: gunicorn/19.9.0
date: Thu, 14 Dec 2023 13:55:07 GMT
content-type: application/json
content-length: 140
access-control-allow-origin: *
access-control-allow-credentials: true
connection: keep-alive
Modify the fault injection policy to change the error fault to a delay fault: introducing a random delay of 500 to 1000 ms.
kubectl apply -n httpbin -f - <<EOF
apiVersion: gateway.flomesh.io/v1alpha1
kind: FaultInjectionPolicy
metadata:
  name: fault-injection
spec:
  targetRef:
    group: gateway.networking.k8s.io
    kind: HTTPRoute
    name: http-route-foo
    namespace: httpbin
  hostnames:
    - hostname: foo.example.com
      config:
        delay:
          percent: 100
          range:
            min: 500
            max: 1000
          unit: ms
EOF
Check the response time of the requests to see the introduced random delay.
time curl -s http://$GATEWAY_IP:8000/headers -H 'host:foo.example.com' > /dev/null

real	0m0.904s
user	0m0.000s
sys	0m0.010s

time curl -s http://$GATEWAY_IP:8000/headers -H 'host:foo.example.com' > /dev/null

real	0m0.572s
user	0m0.005s
sys	0m0.005s
3.7.4.13 - Access Control
Blacklist and whitelist functionality is an effective network security mechanism used to control and manage network traffic. This feature relies on a predefined list of rules to determine which entities (IP addresses or IP ranges) are allowed or denied passage through the gateway. The gateway uses blacklists and whitelists to filter incoming network traffic. This method provides simple and direct access control, easy to manage, and effectively prevents known security threats.
As the entry point for cluster traffic, the FSM Gateway manages all traffic entering the cluster. By setting blacklist and whitelist access control policies, it can filter traffic entering the cluster.
FSM Gateway provides two granularities of access control, both targeting L7 HTTP protocol:
- Domain-level access control: A network traffic management strategy based on domain names. It involves implementing access rules for traffic that meets specific domain name conditions, such as allowing or blocking communication with certain domain names.
- Route-level access control: A management strategy based on routes (request headers, methods, paths, parameters), where access control policies are applied to specific routes to manage traffic accessing those routes.
Next, we will demonstrate the use of blacklist and whitelist access control.
Prerequisites
- Kubernetes cluster version v1.21.0 or higher.
- kubectl CLI
- FSM Gateway installed via guide doc.
Demonstration
Deploying a Sample Application
Next, deploy a sample application using the commonly used httpbin service, and create Gateway and HTTP Route (HttpRoute).
kubectl create namespace httpbin
kubectl apply -n httpbin -f https://raw.githubusercontent.com/flomesh-io/fsm-docs/main/manifests/gateway/http-routing.yaml
Check the gateway and HTTP routes; you should see two routes with different domain names created.
kubectl get gateway,httproute -n httpbin
NAME                                                   CLASS             ADDRESS   PROGRAMMED   AGE
gateway.gateway.networking.k8s.io/simple-fsm-gateway   fsm-gateway-cls             Unknown      3s

NAME                                                 HOSTNAMES             AGE
httproute.gateway.networking.k8s.io/http-route-foo   ["foo.example.com"]   2s
httproute.gateway.networking.k8s.io/http-route-bar   ["bar.example.com"]   2s
Verify if the HTTP routing is effective by accessing the application.
export GATEWAY_IP=$(kubectl get svc -n httpbin -l app=fsm-gateway -o jsonpath='{.items[0].status.loadBalancer.ingress[0].ip}')

curl http://$GATEWAY_IP:8000/headers -H 'host:foo.example.com'
{
  "headers": {
    "Accept": "*/*",
    "Connection": "keep-alive",
    "Host": "10.42.0.15:80",
    "User-Agent": "curl/7.81.0"
  }
}
Domain-Based Access Control
With domain-based access control, we can set one or more domain names in the policy and add a blacklist or whitelist for these domains.
For example, in the policy below:
targetRefis a reference to the target resource for which the policy is applied, which is theHTTPRouteresource for HTTP requests.- Through the
hostnamefield, we add a blacklist or whitelist policy forfoo.example.comamong the two domains. - With the prevalence of cloud services and distributed network architectures, the direct connection to the gateway is no longer the client but an intermediate proxy. In such cases, we usually use the HTTP header
X-Forwarded-Forto identify the client’s IP address. In FSM Gateway’s policy, theenableXFFfield controls whether to obtain the client’s IP address from theX-Forwarded-Forheader. - For denied communications, customize the response with
statusCodeandmessage.
For detailed configuration, please refer to AccessControlPolicy API Reference.
kubectl apply -n httpbin -f - <<EOF
apiVersion: gateway.flomesh.io/v1alpha1
kind: AccessControlPolicy
metadata:
  name: access-control-sample
spec:
  targetRef:
    group: gateway.networking.k8s.io
    kind: HTTPRoute
    name: http-route-foo
    namespace: httpbin
  hostnames:
    - hostname: foo.example.com
      config:
        blacklist:
          - 192.168.0.0/24
        whitelist:
          - 112.94.5.242
        enableXFF:

 true
        statusCode: 403
        message: "Forbidden"
EOF
After the policy is effective, we send requests for testing, remembering to add X-Forwarded-For to specify the client IP.
curl -I http://$GATEWAY_IP:8000/headers -H 'host:foo.example.com'  -H 'x-forwarded-for:112.94.5.242'
HTTP/1.1 200 OK
server: gunicorn/19.9.0
date: Fri, 29 Dec 2023 02:29:08 GMT
content-type: application/json
content-length: 139
access-control-allow-origin: *
access-control-allow-credentials: true
connection: keep-alive

curl -I http://$GATEWAY_IP:8000/headers -H 'host:foo.example.com'  -H 'x-forwarded-for: 10.42.0.1'
HTTP/1.1 403 Forbidden
content-length: 9
connection: keep-alive
From the results, when both a whitelist and a blacklist are present, the blacklist configuration will be ignored.
Route-Based Access Control
Route-based access control allows us to set access control policies for specific routes (path, request headers, method, parameters) to restrict access to these particular routes.
Before setting up the access control policy, we add a route with the path prefix /headers under the HTTP route foo.example.com to facilitate the configuration of access control for it.
kubectl apply -n httpbin -f - <<EOF
apiVersion: gateway.networking.k8s.io/v1
kind: HTTPRoute
metadata:
  name: http-route-foo
spec:
  parentRefs:
  - name: simple-fsm-gateway
    port: 8000
  hostnames:
  - foo.example.com
  rules:
  - matches:
    - path:
        type: PathPrefix
        value: /headers
    backendRefs:
    - name: httpbin
      port: 8080
  - matches:
    - path:
        type: PathPrefix
        value: /
    backendRefs:
    - name: httpbin
      port: 8080
EOF
In the following policy:
- The
matchis used to configure the routes to be matched, here we use path matching. - Other configurations continue to use the settings from above.
kubectl apply -n httpbin -f - <<EOF
apiVersion: gateway.flomesh.io/v1alpha1
kind: AccessControlPolicy
metadata:
  name: access-control-sample
spec:
  targetRef:
    group: gateway.networking.k8s.io
    kind: HTTPRoute
    name: http-route-foo
    namespace: httpbin
  http:
    - match:
        path:
          type: PathPrefix
          value: /headers
      config:
        blacklist:
          - 192.168.0.0/24
        whitelist:
          - 112.94.5.242
        enableXFF: true
        statusCode: 403
        message: "Forbidden"
EOF
After updating the policy, we send requests to test. For the path /headers, the results are as before.
curl -I http://$GATEWAY_IP:8000/headers -H 'host:foo.example.com'  -H 'x-forwarded-for:112.94.5.242'
HTTP/1.1 200 OK
server: gunicorn/19.9.0
date: Fri, 29 Dec 2023 02:39:02 GMT
content-type: application/json
content-length: 139
access-control-allow-origin: *
access-control-allow-credentials: true
connection: keep-alive

curl -I http://$GATEWAY_IP:8000/headers -H 'host:foo.example.com'  -H 'x-forwarded-for: 10.42.0.1'
HTTP/1.1 403 Forbidden
content-length: 9
connection: keep-alive
However, if the path /get is accessed, there are no restrictions.
curl -I http://$GATEWAY_IP:8000/get -H 'host:foo.example.com'  -H 'x-forwarded-for: 10.42.0.1'
HTTP/1.1 200 OK
server: gunicorn/19.9.0
date: Fri, 29 Dec 2023 02:40:18 GMT
content-type: application/json
content-length: 230
access-control-allow-origin: *
access-control-allow-credentials: true
connection: keep-alive
This demonstrates the effectiveness and specificity of route-based access control in managing access to different routes within a network infrastructure.
3.7.4.14 - Rate Limit
Rate limiting in gateways is a crucial network traffic management strategy for controlling the data transfer rate through the gateway, essential for ensuring network stability and efficiency.
FSM Gateway’s rate limiting can be implemented based on various criteria, including port, domain, and route.
- Port-based Rate Limiting: Controls the data transfer rate at the port, ensuring traffic does not exceed a set threshold. This is often used to prevent network congestion and server overload.
- Domain-based Rate Limiting: Sets request rate limits for specific domains. This strategy is typically used to control access frequency to certain services or applications to prevent overload and ensure service quality.
- Route-based Rate Limiting: Sets request rate limits for specific routes or URL paths. This approach allows for more granular traffic control within different parts of a single application.
Configuration
For detailed configuration, please refer to RateLimitPolicy API Reference.
targetRefrefers to the target resource for applying the policy, set here for port granularity, hence referencing theGatewayresourcesimple-fsm-gateway.bps: The default rate limit for the port, measured in bytes per second.config: L7 rate limiting configuration.portsportspecifies the port.bpssets the bytes per second.
hostnameshostname: Domain name.config: L7 rate limiting configuration.
httpmatch:headers: HTTP request matching.method: HTTP method matching.
config: L7 rate limiting configuration.
L7 Rate Limiting Configuration:
backlog: The backlog value refers to the number of requests the system allows to queue when the rate limit threshold is reached. This is an important field, especially when the system suddenly faces a large number of requests that may exceed the set rate limit threshold. The backlog value provides a buffer to handle requests exceeding the rate limit threshold but within the backlog limit. Once the backlog limit is reached, any new requests will be immediately rejected without waiting. This field is optional, defaulting to10.requests: The request value specifies the number of allowed visits within the rate limit time window. This is the core parameter of the rate limiting strategy, determining how many requests can be accepted within a specific time window. The purpose of setting this value is to ensure that the backend system does not receive more requests than it can handle within the given time window. This field is mandatory, with a minimum value of1.statTimeWindow: The rate limit time window (in seconds) defines the period for counting the number of requests. Rate limiting strategies are usually based on sliding or fixed windows. StatTimeWindow defines the size of this window. For example, ifstatTimeWindowis set to 60 seconds, andrequestsis 100, it means a maximum of 100 requests every 60 seconds. This field is mandatory.burst: The burst value represents the maximum number of requests allowed in a short time. This optional field is mainly used to handle short-term request spikes. The burst value is typically higher than the request value, allowing the number of accepted requests in a short time to exceed the average rate. This field is optional.responseStatusCode: The HTTP status code returned to the client when rate limiting occurs. This status code informs the client that the request was rejected due to reaching the rate limit threshold. Common status codes include429 (Too Many Requests), but can be customized as needed. This field is mandatory.responseHeadersToAdd: HTTP headers to be added to the response when rate limiting occurs. This can be used to inform the client about more information regarding the rate limiting policy. For example, aRateLimit-Limitheader can be added to inform the client of the rate limiting configuration. Additional useful information about the current rate limiting policy or how to contact the system administrator can also be provided. This field is optional.
Prerequisites
- Kubernetes Cluster
- kubectl Tool
- FSM Gateway installed via guide doc.
Demonstration
Deploying a Sample Application
Next, deploy a sample application using the popular httpbin service, and create a Gateway and HTTP Route (HttpRoute).
kubectl create namespace httpbin
kubectl apply -n httpbin -f https://raw.githubusercontent.com/flomesh-io/fsm-docs/main/manifests/gateway/http-routing.yaml
Check the gateway and HTTP route, noting the creation of routes for two different domains.
kubectl get gateway,httproute -n httpbin
NAME                                                   CLASS             ADDRESS   PROGRAMMED   AGE
gateway.gateway.networking.k8s.io/simple-fsm-gateway   fsm-gateway-cls             Unknown      3s

NAME                                                 HOSTNAMES             AGE
httproute.gateway.networking.k8s.io/http-route-foo   ["foo.example.com"]   2s
httproute.gateway.networking.k8s.io/http-route-bar   ["bar.example.com"]   2s
Access the application to verify the HTTP route is effective.
export GATEWAY_IP=$(kubectl get svc -n httpbin -l app=fsm-gateway -o jsonpath='{.items[0].status.loadBalancer.ingress[0].ip}')

curl http://$GATEWAY_IP:8000/headers -H 'host:foo.example.com'
{
  "headers": {
    "Accept": "*/*",
    "Connection": "keep-alive",
    "Host": "10.42.0.15:80",
    "User-Agent": "curl/7.81.0"
  }
}
Rate Limiting Test
Port-Based Rate Limiting
Create an 8k file.
dd if=/dev/zero of=payload bs=1K count=8
Test sending the file to the service, which only takes 1s.
time curl -s -X POST -T payload http://$GATEWAY_IP:8000/status/200 -H 'host:foo.example.com'

real	0m1.018s
user	0m0.001s
sys	0m0.014s
Then set the rate limiting policy:
targetRefis the reference to the target resource of the policy, set here for port granularity, hence referencing theGatewayresourcesimple-fsm-gateway.portsportspecifies port 8000bpssets the bytes per second to 2k
kubectl apply -n httpbin -f - <<EOF
apiVersion: gateway.flomesh.io/v1alpha1
kind: RateLimitPolicy
metadata:
  name: ratelimit-sample
spec:
  targetRef:
    group: gateway.networking.k8s.io
    kind: Gateway
    name: simple-fsm-gateway
    namespace: httpbin
  ports:
    - port: 8000
      bps: 2048
EOF
After the policy takes effect, send the 8k file again. Now the rate limiting policy is in effect, and it takes 4 seconds.
time curl -s -X POST -T payload http://$GATEWAY_IP:8000/status/200 -H 'host:foo.example.com'

real	0m4.016s
user	0m0.007s
sys	0m0.005s
Domain-Based Rate Limiting
Before testing domain-based rate limiting, delete the policy created above.
kubectl delete ratelimitpolicies -n httpbin ratelimit-sample
Then use fortio to generate load: 1 concurrent sending 1000 requests at 200 qps.
fortio load -quiet -c 1 -n 1000 -qps 200 -H 'host:foo.example.com' http://$GATEWAY_IP:8000/status/200

Code 200 : 1000 (100.0 %)
Next, set the rate limiting policy:
- Limiting domain
foo.example.com - Backlog of pending requests set to
1 - Max requests in a
60swindow set to200 - Return
429for rate-limited requests with response headerRateLimit-Limit: 200
kubectl apply -n httpbin -f - <<EOF
apiVersion: gateway.flomesh.io/v1alpha1
kind: RateLimitPolicy
metadata:
  name: ratelimit-sample
spec:
  targetRef:
    group: gateway.networking.k8s.io
    kind: HTTPRoute
    name: http-route-foo
    namespace: httpbin
  hostnames:
    - hostname: foo.example.com
      config:
        backlog: 1
        requests: 100
        statTimeWindow: 60
        responseStatusCode: 429
        responseHeadersToAdd:
          - name: RateLimit-Limit
            value: "100"
EOF
After the policy is effective, generate the same load for testing. You can see that 200 responses are successful, and 798 are rate-limited.
-1is the error code set by fortio during read timeout. This is because fortio’s default timeout is3s, and the rate limiting policy sets the backlog to 1. FSM Gateway defaults to 2 threads, so there are 2 timed-out requests.
fortio load -quiet -c 1 -n 1000 -qps 200 -H 'host:foo.example.com' http://$GATEWAY_IP:8000/status/200

Code  -1 : 2 (0.2 %)
Code 200 : 200 (19.9 %)
Code 429 : 798 (79.9 %)
However, accessing bar.example.com will not be rate-limited.
fortio load -quiet -c 1 -n 1000 -qps 200 -H 'host:bar.example.com' http://$GATEWAY_IP:8000/status/200

Code 200 : 1000 (100.0 %)
Route-Based Rate Limiting
Similarly, delete the previously created policy before starting the next test.
kubectl delete ratelimitpolicies -n httpbin ratelimit-sample
Before configuring the access policy,
under the HTTP route foo.example.com, we add a route with the path prefix /headers to facilitate setting the access control policy for it.
kubectl apply -n httpbin -f - <<EOF
apiVersion: gateway.networking.k8s.io/v1
kind: HTTPRoute
metadata:
  name: http-route-foo
spec:
  parentRefs:
  - name: simple-fsm-gateway
    port: 8000
  hostnames:
  - foo.example.com
  rules:
  - matches:
    - path:
        type: PathPrefix
        value: /status/200
    backendRefs:
    - name: httpbin
      port: 8080
  - matches:
    - path:
        type: PathPrefix
        value: /
    backendRefs:
    - name: httpbin
      port: 8080
EOF
Update the rate limiting policy by adding route matching rules: prefix /status/200, other configurations remain unrestricted.
kubectl apply -n httpbin -f - <<EOF
apiVersion: gateway.flomesh.io/v1alpha1
kind: RateLimitPolicy
metadata:
  name: ratelimit-sample
spec:
  targetRef:
    group: gateway.networking.k8s.io
    kind: HTTPRoute
    name: http-route-foo
    namespace: httpbin
  http:
    - match:
        path:
          type: PathPrefix
          value: /status/200
      config:
        backlog: 1
        requests: 100
        statTimeWindow: 60
        responseStatusCode: 429
        responseHeadersToAdd:
          - name: RateLimit-Limit
            value: "100"
EOF
After applying the policy, send the same load. From the results, only 200 requests are successful.
fortio load -quiet -c 1 -n 1000 -qps 200 -H 'host:foo.example.com' http://$GATEWAY_IP:8000/status/200

Code  -1 : 2 (0.2 %)
Code 200 : 200 (20.0 %)
Code 429 : 798 (79.8 %)
When the path /status/204 is used, it will not be subject to rate limiting.
fortio load -quiet -c 1 -n 1000 -qps 200 -H 'host:foo.example.com' http://$GATEWAY_IP:8000/status/204

Code 204 : 1000 (100.0 %)
3.7.4.15 - Retry
The retry functionality of a gateway is a crucial network communication mechanism designed to enhance the reliability and fault tolerance of system service calls. This feature allows the gateway to automatically resend a request if the initial request fails, thereby reducing the impact of temporary issues (such as network fluctuations, momentary service overloads, etc.) on the end-user experience.
The working principle is, when the gateway sends a request to a downstream service and encounters specific types of failures (such as connection errors, timeouts, 5xx series errors, etc.), it attempts to resend the request based on pre-set policies instead of immediately returning the error to the client.
Prerequisites
- Kubernetes cluster
- kubectl tool
- FSM Gateway installed via guide doc.
Demonstration
Deploying Example Application
We use the fortio server as the example application, which allows defining response status codes and their occurrence probabilities through the status request parameter.
kubectl create namespace server
kubectl apply -n server -f - <<EOF
apiVersion: v1
kind: Service
metadata:
  name: fortio
  labels:
    app: fortio
    service: fortio
spec:
  ports:
  - port: 8080
    name: http-8080
  selector:
    app: fortio
---
apiVersion: apps/v1
kind: Deployment
metadata:
  name: fortio
spec:
  replicas: 1
  selector:
    matchLabels:
      app: fortio
  template:
    metadata:
      labels:
        app: fortio
    spec:
      containers:
      - name: fortio
        image: fortio/fortio:latest_release
        imagePullPolicy: Always
        ports:
        - containerPort: 8080
          name: http
EOF
Creating Gateway and Route
kubectl apply -n server -f - <<EOF
apiVersion: gateway.networking.k8s.io/v1
kind: Gateway
metadata:
  name: simple-fsm-gateway
spec:
  gatewayClassName: fsm-gateway-cls
  listeners:
  - protocol: HTTP
    port: 8000
    name: http
    allowedRoutes:
      namespaces:
        from: Same
---
apiVersion: gateway.networking.k8s.io/v1
kind: HTTPRoute
metadata:
  name: fortio-route
spec:
  parentRefs:
  - name: simple-fsm-gateway
    port: 8000
  rules:
  - matches:
    - path:
        type: PathPrefix
        value: /
    backendRefs:
    - name: fortio
      port: 8080
EOF
Check if the application is accessible.
export GATEWAY_IP=$(kubectl get svc -n server -l app=fsm-gateway -o jsonpath='{.items[0].status.loadBalancer.ingress[0].ip}')

curl -i http://$GATEWAY_IP:8000/echo
HTTP/1.1 200 OK
date: Fri, 05 Jan 2024 07:02:17 GMT
content-length: 0
connection: keep-alive
Testing Retry Strategy
Before setting the retry strategy, add the parameter status=503:10 to make the fortio server have a 10% chance of returning 503. Using fortio load to generate load, sending 100 requests will see nearly 10% are 503 responses.
fortio load -quiet -c 1 -n 100 http://$GATEWAY_IP:8000/echo\?status\=503:10

Code 200 : 89 (89.0 %)
Code 503 : 11 (11.0 %)
All done 100 calls (plus 0 warmup) 1

.054 ms avg, 8.0 qps
Then set the retry strategy.
targetRefspecifies the target resource for the policy, which in the retry policy can only be aServicein K8scoreorServiceImportinflomesh.io(the latter for multi-cluster). Here we specify thefortioin namespaceserver.portsis the list of service ports, as the service may expose multiple ports, different ports can have different retry strategies.portis the service port, set to8080for thefortioservice in this example.configis the core configuration of the retry policy.retryOnis the list of response codes that are retryable, e.g., 5xx matches 500-599, or 500 matches only 500.numRetriesis the number of retries.backoffBaseIntervalis the base interval for calculating backoff (in seconds), i.e., the waiting time between consecutive retry requests. It’s mainly to avoid additional pressure on services that are experiencing problems.
For detailed retry policy configuration, refer to the official documentation RetryPolicy.
kubectl apply -n server -f - <<EOF
apiVersion: gateway.flomesh.io/v1alpha1
kind: RetryPolicy
metadata:
  name: retry-policy-sample
spec:
  targetRef:
    kind: Service
    name: fortio
    namespace: server
  ports:
  - port: 8080
    config:
      retryOn:
      - 5xx
      numRetries: 5
      backoffBaseInterval: 2
EOF
After the policy takes effect, send the same 100 requests, and you can see all are 200 responses. Note that the average response time has increased due to the added time for retries.
fortio load -quiet -c 1 -n 100 http://$GATEWAY_IP:8000/echo\?status\=503:10

Code 200 : 100 (100.0 %)
All done 100 calls (plus 0 warmup) 160.820 ms avg, 5.8 qps
3.7.4.16 - Session Sticky
Session sticky in a gateway is a network technology designed to ensure that a user’s consecutive requests are directed to the same backend server over a period of time. This functionality is particularly crucial in scenarios requiring user state maintenance or continuous interaction, such as maintaining online shopping carts, keeping users logged in, or handling multi-step transactions.
Session sticky plays a key role in enhancing website performance and user satisfaction by providing a consistent user experience and maintaining transaction integrity. It is typically implemented using client identification information like Cookies or server-side IP binding techniques, thereby ensuring request continuity and effective server load balancing.
Prerequisites
- Kubernetes cluster
- kubectl tool
- FSM Gateway installed via guide doc.
Demonstration
Deploying a Sample Application
To verify the session sticky feature, create the Service pipy, and set up two endpoints with different responses. These endpoints are simulated using the programmable proxy Pipy.
kubectl create namespace server
kubectl apply -n server -f - <<EOF
apiVersion: v1
kind: Service
metadata:
  name: pipy
spec:
  selector:
    app: pipy
  ports:
    - protocol: TCP
      port: 8080
      targetPort: 8080

---
apiVersion: v1
kind: Pod
metadata:
  name: pipy-1
  labels:
    app: pipy
spec:
  containers:
  - name: pipy
    image: flomesh/pipy:0.99.0-2
    command: ["pipy", "-e", "pipy().listen(8080).serveHTTP(new Message({status: 200},'Hello, world'))"]

---
apiVersion: v1
kind: Pod
metadata:
  name: pipy-2
  labels:
    app: pipy
spec:
  containers:
  - name: pipy
    image: flomesh/pipy:0.99.0-2
    command: ["pipy", "-e", "pipy().listen(8080).serveHTTP(new Message({status: 503},'Service unavailable'))"]
EOF
Creating Gateway and Routes
Next, create a gateway and set up routes for the Service pipy.
kubectl apply -n server -f - <<EOF
apiVersion: gateway.networking.k8s.io/v1
kind: Gateway
metadata:
  name: simple-fsm-gateway
spec:
  gatewayClassName: fsm-gateway-cls
  listeners:
  - protocol: HTTP
    port: 8000
    name: http
    allowedRoutes:
      namespaces:
        from: Same
---
apiVersion: gateway.networking.k8s.io/v1
kind: HTTPRoute
metadata:
  name: fortio-route
spec:
  parentRefs:
  - name: simple-fsm-gateway
    port: 8000
  rules:
  - matches:
    - path:
        type: PathPrefix
        value: /
    backendRefs:
    - name: pipy
      port: 8080
EOF
Check if the application is accessible. Results show that the gateway has balanced the load across two endpoints.
export GATEWAY_IP=$(kubectl get svc -n server -l app=fsm-gateway -o jsonpath='{.items[0].status.loadBalancer.ingress[0].ip}')

curl http://$GATEWAY_IP:8000/
Service unavailable

curl http://$GATEWAY_IP:8000/
Hello, world
Testing Session Sticky Strategy
Next, configure the session sticky strategy.
targetRefspecifies the target resource for the policy. In this policy, the target resource can only be a K8scoreService. Here, thepipyin theservernamespace is specified.portsis a list of service ports, as a service may expose multiple ports, allowing different ports to set retry strategies.portis the service port, set to8080for thepipyservice in this example.configis the core configuration of the strategy.cookieNameis the name of the cookie used for session sticky via cookie-based load balancing. This field is optional, but when cookie-based session sticky is enabled, it defines the name of the cookie storing backend server information, such as_srv_id. This means that when a user first visits the application, a cookie named_srv_idis set, typically corresponding to a backend server. When the user revisits, this cookie ensures their requests are routed to the same server as before.expiresis the lifespan of the cookie during session sticky. This defines how long the cookie will last, i.e., how long the user’s consecutive requests will be directed to the same backend server.
For detailed configuration, refer to the official documentation SessionStickyPolicy.
kubectl apply -n server -f - <<EOF
apiVersion: gateway.flomesh.io/v1alpha1
kind: SessionStickyPolicy
metadata:
  name: session-sticky-policy-sample
spec:
  targetRef:
    group: ""
    kind: Service
    name: pipy
    namespace: server
  ports:
  - port: 8080
    config:
      cookieName: _srv_id
      expires: 600
EOF
After creating the policy, send requests again. By adding the option -i, you can see the cookie information added in the response header.
curl -i http://$GATEWAY_IP:8000/
HTTP/1.1 200 OK
set-cookie: _srv_id=7252425551334343; path=/; expires=Fri,  5 Jan 2024 19:15:23 GMT; max-age=600
content-length: 12
connection: keep-alive

Hello, world
Send 3 requests next, adding the cookie information from the above response with the -b parameter. All 3 requests receive the same response, indicating that the session sticky feature is effective.
curl -b _srv_id=7252425551334343 http://$GATEWAY_IP:8000/
Hello, world

curl -b _srv_id=7252425551334343 http://$GATEWAY_IP:8000/
Hello, world

curl -b _srv_id=7252425551334343 http://$GATEWAY_IP:8000/
Hello, world
3.7.4.17 - Health Check
Gateway health check is an automated monitoring mechanism that regularly checks and verifies the health of backend services, ensuring traffic is only forwarded to those services that are healthy and can handle requests properly. This feature is crucial in microservices or distributed systems, as it maintains high availability and resilience by promptly identifying and isolating faulty or underperforming services.
Health checks enable gateways to ensure that request loads are effectively distributed to well-functioning services, thereby improving the overall system stability and response speed.
Prerequisites
- Kubernetes cluster
- kubectl tool
- FSM Gateway installed via guide doc.
Demonstration
Deploying a Sample Application
To test the health check functionality, create two endpoints with different health statuses. This is achieved by creating the Service pipy, with two endpoints simulated using the programmable proxy Pipy.
kubectl create namespace server
kubectl apply -n server -f - <<EOF
apiVersion: v1
kind: Service
metadata:
  name: pipy
spec:
  selector:
    app: pipy
  ports:
    - protocol: TCP
      port: 8080
      targetPort: 8080
---
apiVersion: v1
kind: Pod
metadata:
  name: pipy-1
  labels:
    app: pipy
spec:
  containers:
  - name: pipy
    image: flomesh/pipy:0.99.0-2
    command: ["pipy", "-e", "pipy().listen(8080).serveHTTP(new Message({status: 200},'Hello, world'))"]
---
apiVersion: v1
kind: Pod
metadata:
  name: pipy-2
  labels:
    app: pipy
spec:
  containers:
  - name: pipy
    image: flomesh/pipy:0.99.0-2
    command: ["pipy", "-e", "pipy().listen(8080).serveHTTP(new Message({status: 503},'Service unavailable'))"]
EOF
Creating Gateway and Routes
Next, create a gateway and set up routes for the Service pipy.
kubectl apply -n server -f - <<EOF
apiVersion: gateway.networking.k8s.io/v1
kind: Gateway
metadata:
  name: simple-fsm-gateway
spec:
  gatewayClassName: fsm-gateway-cls
  listeners:
  - protocol: HTTP
    port: 8000
    name: http
    allowedRoutes:
      namespaces:
        from: Same
---
apiVersion: gateway.networking.k8s.io/v1
kind: HTTPRoute
metadata:
  name: fortio-route
spec:
  parentRefs:
  - name: simple-fsm-gateway
    port: 8000
  rules:
  - matches:
    - path:
        type: PathPrefix
        value: /
    backendRefs:
    - name: pipy
      port: 8080
EOF
Check if the application is accessible. The results show that the gateway has balanced the load between a healthy endpoint and an unhealthy one.
export GATEWAY_IP=$(kubectl get svc -n server -l app=fsm-gateway -o jsonpath='{.items[0].status.loadBalancer.ingress[0].ip}')
curl -o /dev/null -s -w '%{http_code}' http://$GATEWAY_IP:8000/
200
curl -o /dev/null -s -w '%{http_code}' http://$GATEWAY_IP:8000/
503
Testing Health Check Functionality
Next, configure the health check policy.
targetRefspecifies the target resource for the policy, which can only be a K8scoreService. Here, thepipyin theservernamespace is specified.portsis a list of service ports, as a service may expose multiple ports, allowing different ports to set retry strategies.portis the service port, set to8080for thepipyservice in this example.configis the core configuration of the policy.interval: Health check interval, indicating the time interval at which the system performs health checks on backend services.maxFails: Maximum failure count, defining the consecutive health check failures allowed before marking an upstream service as unavailable. This is a key parameter as it determines the system’s tolerance before deciding a service is unhealthy.failTimeout: Failure timeout, defining the length of time an upstream service will be temporarily disabled after being marked unhealthy. This means that even if the service becomes available again, it will be considered unavailable by the proxy during this period.path: Health check path, used for the path in HTTP health checks.matches: Matching conditions, used to determine the success or failure of HTTP health checks. This field can contain multiple conditions, such as expected HTTP status codes, response body content, etc.statusCodes: A list of HTTP response status codes to match, such as[200,201,204].body: The body content of the HTTP response to match.headers: The header information of the HTTP response to match. This field is optional.name: It defines the specific field name you want to match in the HTTP response header. For example, to check the value of theContent-Typeheader, you would setnametoContent-Type. This field is only valid whenTypeis set toheadersand should not be set in other cases. This field is optional.value: The expected matching value. Defines the expected match value. For example,
For detailed policy configuration, refer to the official documentation HealthCheckPolicy.
kubectl apply -n server -f - <<EOF
apiVersion: gateway.flomesh.io/v1alpha1
kind: HealthCheckPolicy
metadata:
  name: health-check-policy-sample
spec:
  targetRef:
    group: ""
    kind: Service
    name: pipy
    namespace: server
  ports:
  - port: 8080
    config:
      interval: 10
      maxFails: 3
      failTimeout: 1
      path: /healthz
      matches:
      - statusCodes:
        - 200
        - 201
EOF
After this configuration, multiple requests consistently return a 200 response, indicating the unhealthy endpoint has been isolated by the gateway.
curl -o /dev/null -s -w '%{http_code}' http://$GATEWAY_IP:8000/
200
curl -o /dev/null -s -w '%{http_code}' http://$GATEWAY_IP:8000/
200
curl -o /dev/null -s -w '%{http_code}' http://$GATEWAY_IP:8000/
200
3.7.4.18 - Loadbalancing Algorithm
In microservices and API gateway architectures, load balancing is critical for evenly distributing requests across each service instance and providing mechanisms for high availability and fault recovery. FSM Gateway offers various load balancing algorithms, allowing the selection of the most suitable method based on business needs and traffic patterns.
Multiple load balancing algorithms support efficient traffic distribution, maximizing resource utilization and improving service response times:
- RoundRobinLoadBalancer: A common load balancing algorithm where requests are sequentially assigned to each service instance. This is FSM Gateway’s default algorithm unless otherwise specified.
- HashingLoadBalancer: Calculates a hash value based on certain request attributes (like source IP or headers), routing requests to specific service instances. This ensures the same requester or type of request is always routed to the same service instance.
- LeastConnectionLoadBalancer: Considers the current workload (number of connections) of each service instance, allocating new requests to the instance with the least load, ensuring more even resource utilization.
Prerequisites
- Kubernetes cluster
- kubectl tool
- FSM Gateway installed via guide doc.
Demonstration
Deploying a Sample Application
To test load balancing, create two endpoints with different response statuses (200, 201) and content. This is done by creating the Service pipy, with two endpoints simulated using the programmable proxy Pipy.
kubectl create namespace server
kubectl apply -n server -f - <<EOF
apiVersion: v1
kind: Service
metadata:
  name: pipy
spec:
  selector:
    app: pipy
  ports:
    - protocol: TCP
      port: 8080
      targetPort: 8080
---
apiVersion: v1
kind: Pod
metadata:
  name: pipy-1
  labels:
    app: pipy
spec:
  containers:
  - name: pipy
    image: flomesh/pipy:0.99.0-2
    command: ["pipy", "-e", "pipy().listen(8080).serveHTTP(new Message({status: 200},'Hello, world'))"]
---
apiVersion: v1
kind: Pod
metadata:
  name: pipy-2
  labels:
    app: pipy
spec:
  containers:
  - name: pipy
    image: flomesh/pipy:0.99.0-2
    command: ["pipy", "-e", "pipy().listen(8080).serveHTTP(new Message({status: 201},'Hi, world'))"]
EOF
Creating Gateway and Routes
Next, create a gateway and set up routes for the Service pipy.
kubectl apply -n server -f - <<EOF
apiVersion: gateway.networking.k8s.io/v1
kind: Gateway
metadata:
  name: simple-fsm-gateway
spec:
  gatewayClassName: fsm-gateway-cls
  listeners:
  - protocol: HTTP
    port: 8000
    name: http
    allowedRoutes:
      namespaces:
        from: Same
---
apiVersion: gateway.networking.k8s.io/v1
kind: HTTPRoute
metadata:
  name: fortio-route
spec:
  parentRefs:
  - name: simple-fsm-gateway
    port: 8000
  rules:
  - matches:
    - path:
        type: PathPrefix
        value: /
    backendRefs:
    - name: pipy
      port: 8080
EOF
Check application accessibility. The results show that the gateway balanced the load across the two endpoints using the default round-robin algorithm.
export GATEWAY_IP=$(kubectl get svc -n server -l app=fsm-gateway -o jsonpath='{.items[0].status.loadBalancer.ingress[0].ip}')
curl http://$GATEWAY_IP:8000/
Hi, world
curl http://$GATEWAY_IP:8000/
Hello, world
curl http://$GATEWAY_IP:8000/
Hi, world
Load Balancing Algorithm Verification
For configuring load balancing strategies, refer to the LoadBalancerPolicy documentation.
Round-Robin Load Balancing
Test with fortio load: Send 200 requests with 50 concurrent users. Responses of status codes 200 and 201 are evenly split, indicative of round-robin load balancing.
fortio load -quiet -c 50 -n 200 http://$GATEWAY_IP:8000/
Code 200 : 100 (50.0 %)
Code 201 : 100 (50.0 %)
Hashing Load Balancer
Set the load balancing policy to HashingLoadBalancer.
kubectl apply -n server -f - <<EOF
apiVersion: gateway.flomesh.io/v1alpha1
kind: LoadBalancerPolicy
metadata:
  name: lb-policy-sample
spec:
  targetRef:
    group: ""
    kind: Service
    name: pipy
    namespace: server
  ports:
    - port: 8080
      type: HashingLoadBalancer
EOF
Sending the same load, all 200 requests are routed to one endpoint, consistent with the hash-based load balancing.
fortio load -quiet -c 50 -n 200 http://$GATEWAY_IP:8000/
Code 201 : 200 (50.0 %)
Least Connections Load Balancer
In Kubernetes, multiple endpoints of the same Service usually have the same specifications, so the effect of the least connections algorithm is similar to round-robin.
kubectl apply -n server -f - <<EOF
apiVersion: gateway.flomesh.io/v1alpha1
kind: LoadBalancerPolicy
metadata:
  name: lb-policy-sample
spec:
  targetRef:
    group: ""
    kind: Service
    name: pipy
    namespace: server
  ports:
    - port: 8080
      type: LeastConnectionLoadBalancer
EOF
Sending the same load, the traffic is evenly distributed across the two endpoints, as expected.
fortio load -quiet -c 50 -n 200 http://$GATEWAY_IP:8000/
Code 200 : 100 (50.0 %)
Code 201 : 100 (50.0 %)
3.7.4.19 - Upstream TLS
Using HTTP for external client communication and HTTPS for upstream services is a common network architecture pattern. In this setup, the gateway acts as the SSL/TLS termination point, ensuring secure encrypted communication with upstream services. This means that even though the client-to-gateway communication uses standard unencrypted HTTP protocol, the gateway securely converts these requests to HTTPS for communication with upstream services.
Centralized certificate management simplifies security maintenance, enhancing system reliability and manageability. This pattern is particularly practical in scenarios requiring protected internal communication while balancing front-end compatibility and performance.
Prerequisites
- Kubernetes cluster
- kubectl tool
- FSM Gateway installed via guide doc.
Demonstration
Deploying Sample Application
Our upstream application uses HTTPS, so first, generate a self-signed certificate. The following commands generate a CA certificate, server certificate, and key.
openssl genrsa 2048 > ca-key.pem

openssl req -new -x509 -nodes -days 365000 \
   -key ca-key.pem \
   -out ca-cert.pem \
   -subj '/CN=flomesh.io'

openssl genrsa -out server-key.pem 2048
openssl req -new -key server-key.pem -out server.csr -subj '/CN=foo.example.com'
openssl x509 -req -in server.csr -CA ca-cert.pem -CAkey ca-key.pem -CAcreateserial -out server-cert.pem -days 365
Create a Secret server-cert using the server certificate and key.
kubectl create namespace httpbin
#TLS cert secret
kubectl create secret generic -n httpbin server-cert \
  --from-file=./server-cert.pem \
  --from-file=./server-key.pem
The sample application still uses the httpbin image, but now with TLS enabled using the created certificate and key.
kubectl apply -n httpbin -f - <<EOF
apiVersion: apps/v1
kind: Deployment
metadata:
  name: httpbin
spec:
  replicas: 1
  selector:
    matchLabels:
      app: httpbin
  template:
    metadata:
      labels:
        app: httpbin
    spec:
      containers:
      - name: httpbin
        image: kennethreitz/httpbin
        ports:
        - containerPort: 443
        volumeMounts:
        - name: cert-volume
          mountPath: /etc/httpbin/certs  # Mounting path in the container
        command: ["gunicorn"]
        args: ["-b", "0.0.0.0:443", "httpbin:app", "-k", "gevent", "--certfile", "/etc/httpbin/certs/server-cert.pem", "--keyfile", "/etc/httpbin/certs/server-key.pem"]
      volumes:
      - name: cert-volume
        secret:
          secretName: server-cert
---
apiVersion: v1
kind: Service
metadata:
  name: httpbin
spec:
  selector:
    app: httpbin
  ports:
    - protocol: TCP
      port: 8443
      targetPort: 443
EOF
Verify if HTTPS has been enabled.
export HTTPBIN_POD=$(kubectl get po -n httpbin -l app=httpbin -o jsonpath='{.items[0].metadata.name}')

kubectl port-forward -n httpbin $HTTPBIN_POD 8443:443 &
# access with CA cert
curl --cacert ca-cert.pem https://foo.example.com/headers --connect-to foo.example.com:443:127.0.0.1:8443
{
  "headers": {
    "Accept": "*/*",
    "Host": "foo.example.com",
    "User-Agent": "curl/8.1.2"
  }
}
Creating Gateway and Routes
Next, create a gateway and route for the Service httpbin.
kubectl apply -n httpbin -f - <<EOF
apiVersion: gateway.networking.k8s.io/v1
kind: Gateway
metadata:
  name: simple-fsm-gateway
spec:
  gatewayClassName: fsm-gateway-cls
  listeners:
  - protocol: HTTP
    port: 8000
    name: http
    allowedRoutes:
      namespaces:
        from: Same
---
apiVersion: gateway.networking.k8s.io/v1
kind: HTTPRoute
metadata:
  name: http-route-foo
spec:
  parentRefs:
  - name: simple-fsm-gateway
    port: 8000
  hostnames:
  - foo.example.com
  rules:
  - matches:
    - path:
        type: PathPrefix
        value: /
    backendRefs:
    - name: httpbin
      port: 8443
EOF
At this point, accessing httpbin through the gateway is not possible, as httpbin has TLS enabled and the gateway cannot verify its server certificate.
curl http://foo.example.com/headers --connect-to foo.example.com:80:$GATEWAY_IP:8000
curl: (52) Empty reply from server
Upstream TLS Policy Verification
Create a Secret https-cert using the previously created CA certificate.
#CA cert secret
kubectl create secret generic -n httpbin https-cert --from-file=ca.crt=ca-cert.pem
Next, create an Upstream TLS Policy UpstreamTLSPolicy. Refer to the document UpstreamTLSPolicy and specify the Secret https-cert, containing the CA certificate, for the upstream service httpbin. The gateway will use this certificate to verify httpbin’s server certificate.
kubectl apply -n httpbin -f - <<EOF
apiVersion: gateway.flomesh.io/v1alpha1
kind: UpstreamTLSPolicy
metadata:
name: upstream-tls-policy-sample
spec:
targetRef:
group: ""
kind: Service
name: httpbin
namespace: httpbin
ports:
- port: 8443
config:
certificateRef:
namespace: httpbin
name: https-cert
mTLS: false
EOF
After applying this policy and once it takes effect, try accessing the httpbin service through the gateway again.
curl http://foo.example.com/headers --connect-to foo.example.com:80:$GATEWAY_IP:8000
{
"headers": {
"Accept": "*/*",
"Connection": "keep-alive",
"Host": "10.42.0.25:443",
"User-Agent": "curl/8.1.2"
}
}
3.7.4.20 - Gateway mTLS
Enabling mTLS (Mutual TLS Verification) at the gateway is an advanced security measure that requires both the server to prove its identity to the client and vice versa. This mutual authentication significantly enhances communication security, ensuring only clients with valid certificates can establish a connection with the server. mTLS is particularly suitable for highly secure scenarios, such as financial transactions, corporate networks, or applications involving sensitive data. It provides a robust authentication mechanism, effectively reducing unauthorized access and helping organizations comply with strict data protection regulations.
By implementing mTLS, the gateway not only secures data transmission but also provides a more reliable and secure interaction environment between clients and servers.
Prerequisites
- Kubernetes cluster
- kubectl tool
- FSM Gateway installed via guide doc.
Demonstration
Creating Gateway TLS Certificate
openssl genrsa 2048 > ca-key.pem
openssl req -new -x509 -nodes -days 365000 \
-key ca-key.pem \
-out ca-cert.pem \
-subj '/CN=flomesh.io'
openssl genrsa -out server-key.pem 2048
openssl req -new -key server-key.pem -out server.csr -subj '/CN=foo.example.com'
openssl x509 -req -in server.csr -CA ca-cert.pem -CAkey ca-key.pem -CAcreateserial -out server-cert.pem -days 365
Create a Secret server-cert using the CA certificate, server certificate, and key. When the gateway only enables TLS, only the server certificate and key are used.
kubectl create namespace httpbin
#TLS cert secret
kubectl create secret generic -n httpbin simple-gateway-cert \
--from-file=tls.crt=./server-cert.pem \
--from-file=tls.key=./server-key.pem \
--from-file=ca.crt=ca-cert.pem
Deploying Sample Application
Deploy the httpbin service and create a TLS gateway and route for it.
kubectl apply -n httpbin -f https://raw.githubusercontent.com/flomesh-io/fsm-docs/main/manifests/gateway/tls-termination.yaml
Access the httpbin service through the gateway using the CA certificate created earlier, successfully accessing it.
curl --cacert ca-cert.pem https://foo.example.com/headers --connect-to foo.example.com:443:$GATEWAY_IP:8000
{
"headers": {
"Accept": "*/*",
"Host": "foo.example.com",
"User-Agent": "curl/8.1.2"
}
}
Gateway mTLS Verification
Enabling mTLS
Now, following the GatewayTLSPolicy document, enable mTLS for the gateway.
kubectl apply -n httpbin -f - <<EOF
apiVersion: gateway.flomesh.io/v1alpha1
kind: GatewayTLSPolicy
metadata:
name: gateway-tls-policy-sample
spec:
targetRef:
group: gateway.networking.k8s.io
kind: Gateway
name: simple-fsm-gateway
namespace: httpbin
ports:
- port: 8000
config:
mTLS: true
EOF
At this point, if we still use the original method of access, the access will be denied. The gateway has now started mutual mTLS authentication and will verify the client’s certificate.
curl --cacert ca-cert.pem https://foo.example.com/headers --connect-to foo.example.com:443:$GATEWAY_IP:8000
curl: (52) Empty reply from server
Issuing Client Certificate
Using the CA certificate created earlier, issue a certificate for the client.
openssl genrsa -out client-key.pem 2048
openssl req -new -key client-key.pem -out client.csr -subj '/CN=example.com'
openssl x509 -req -in client.csr -CA ca-cert.pem -CAkey ca-key.pem -CAcreateserial -out client-cert.pem -days 365
Now, when making a request, in addition to specifying the CA certificate, also specify the client’s certificate and key to successfully pass the gateway’s verification and access.
curl --cacert ca-cert.pem --cert client-cert.pem --key client-key.pem https://foo.example.com/headers --connect-to foo.example.com:443:$GATEWAY_IP:8000
{
"headers": {
"Accept": "*/*",
"Host": "foo.example.com",
"User-Agent": "curl/8.1.2"
}
}
3.7.4.21 - Traffic Mirroring
Traffic mirroring, sometimes also known as traffic cloning, is primarily used to send a copy of network traffic to another service without affecting production traffic. This feature is commonly utilized for fault diagnosis, performance monitoring, data analysis, and security auditing. Traffic mirroring enables real-time data capture and analysis without disrupting existing business processes.
The Kubernetes Gateway API’s HTTPRequestMirrorFilter provides a definition for traffic mirroring capabilities.
Prerequisites
- Kubernetes cluster
- kubectl tool
- FSM Gateway installed via guide doc.
Demonstration
Deploy Example Applications
To verify the traffic mirroring functionality, at least two backend services are needed. In these services, we will print the request headers to standard output to verify the mirroring functionality via log examination.
We use the programmable proxy Pipy to simulate an echo service and print the request headers.
kubectl create namespace server
kubectl apply -n server -f - <<EOF
apiVersion: v1
kind: Service
metadata:
name: pipy
spec:
selector:
app: pipy
ports:
- protocol: TCP
port: 8080
targetPort: 8080
---
apiVersion: v1
kind: Pod
metadata:
name: pipy
labels:
app: pipy
spec:
containers:
- name: pipy
image: flomesh/pipy:1.0.0-1
command: ["pipy", "-e", "pipy().listen(8080).serveHTTP(msg=>(console.log(msg.head),msg))"]
EOF
Create Gateway and Route
Next, create a gateway and a route for the Service pipy.
kubectl apply -n server -f - <<EOF
apiVersion: gateway.networking.k8s.io/v1
kind: Gateway
metadata:
name: simple-fsm-gateway
spec:
gatewayClassName: fsm-gateway-cls
listeners:
- protocol: HTTP
port: 8000
name: http
allowedRoutes:
namespaces:
from: Same
---
apiVersion: gateway.networking.k8s.io/v1
kind: HTTPRoute
metadata:
name: http-route-sample
spec:
parentRefs:
- name: simple-fsm-gateway
port: 8000
rules:
- matches:
- path:
type: PathPrefix
value: /
backendRefs:
- name: pipy
port: 8080
EOF
Attempt accessing the route:
curl http://$GATEWAY_IP:8000/ -d 'Hello world'
Hello world
You can view the logs of the pod pipy. Here, we use the stern tool to view logs from multiple pods simultaneously, and later we will deploy the mirror service.
stern . -c pipy -n server --tail 0
+ pipy › pipy
pipy › pipy 2024-04-28 03:57:03.918 [INF] { protocol: "HTTP/1.1", headers: { "host": "198.19.249.153:8000", "user-agent": "curl/8.4.0", "accept": "*/*", "content-type": "application/x-www-form-urlencoded", "x-forwarded-for": "10.42.0.1", "content-length": "11" }, headerNames: { "host": "Host", "user-agent": "User-Agent", "accept": "Accept", "content-type": "Content-Type" }, method: "POST", scheme:
undefined, authority: undefined, path: "/" }
Deploying Mirror Service
Next, let’s deploy a mirror service pipy-mirror, which can similarly print the request headers.
kubectl apply -n server -f - <<EOF
apiVersion: v1
kind: Service
metadata:
name: pipy-mirror
spec:
selector:
app: pipy-mirror
ports:
- protocol: TCP
port: 8080
targetPort: 8080
---
apiVersion: v1
kind: Pod
metadata:
name: pipy-mirror
labels:
app: pipy-mirror
spec:
containers:
- name: pipy
image: flomesh/pipy:1.0.0-1
command: ["pipy", "-e", "pipy().listen(8080).serveHTTP(msg=>(console.log(msg.head),msg))"]
EOF
Configure Traffic Mirroring Policy
Modify the HTTP route to add a RequestMirror type filter and set the backendRef to the mirror service pipy-mirror created above.
kubectl apply -n server -f - <<EOF
apiVersion: gateway.networking.k8s.io/v1
kind: HTTPRoute
metadata:
name: http-route-sample
spec:
parentRefs:
- name: simple-fsm-gateway
port: 8000
rules:
- matches:
- path:
type: PathPrefix
value: /
filters:
- type: RequestMirror
requestMirror:
backendRef:
kind: Service
name: pipy-mirror
port: 8080
backendRefs:
- name: pipy
port: 8080
EOF
After applying the policy, send another request and both pods should display the printed request headers.
stern . -c pipy -n server --tail 0
+ pipy › pipy
+ pipy-mirror › pipy
pipy-mirror pipy 2024-04-28 04:11:04.537 [INF] { protocol: "HTTP/1.1", headers: { "host": "198.19.249.153:8000", "user-agent": "curl/8.4.0", "accept": "*/*", "content-type": "application/x-www-form-urlencoded", "x-forwarded-for": "10.42.0.1", "content-length": "11" }, headerNames: { "host": "Host", "user-agent": "User-Agent", "accept": "Accept", "content-type": "Content-Type" }, method: "POST", scheme: undefined, authority: undefined, path: "/" }
pipy pipy 2024-04-28 04:11:04.537 [INF] { protocol: "HTTP/1.1", headers: { "host": "198.19.249.153:8000", "user-agent": "curl/8.4.0", "accept": "*/*", "content-type": "application/x-www-form-urlencoded", "x-forwarded-for": "10.42.0.1", "content-length": "11" }, headerNames: { "host": "Host", "user-agent": "User-Agent", "accept": "Accept", "content-type": "Content-Type" }, method: "POST", scheme: undefined, authority: undefined, path: "/" }
3.8 - Egress
3.8.1 - Egress
Allowing access to the Internet and out-of-mesh services (Egress)
This document describes the steps required to enable access to the Internet and services external to the service mesh, referred to as Egress traffic.
FSM redirects all outbound traffic from a pod within the mesh to the pod’s sidecar proxy. Outbound traffic can be classified into two categories:
- Traffic to services within the mesh cluster, referred to as in-mesh traffic
- Traffic to services external to the mesh cluster, referred to as egress traffic
While in-mesh traffic is routed based on L7 traffic policies, egress traffic is routed differently and is not subject to in-mesh traffic policies. FSM supports access to external services as a passthrough without subjecting such traffic to filtering policies.
Configuring Egress
There are two mechanisms to configure Egress:
- Using the Egress policy API: to provide fine grained access control over external traffic
- Using the mesh-wide global egress passthrough setting: the setting is toggled on or off and affects all pods in the mesh, enabling which allows traffic destined to destinations outside the mesh to egress the pod.
1. Configuring Egress policies
FSM supports configuring fine grained policies for traffic destined to external endpoints using its Egress policy API. To use this feature, enable it if not enabled:
# Replace fsm-system with the namespace where FSM is installed
kubectl patch meshconfig fsm-mesh-config -n fsm-system -p '{"spec":{"featureFlags":{"enableEgressPolicy":true},"traffic":{"enableEgress":false}}}' --type=merge
Remember to disable egress passthrough with set
traffic.enableEgress: false.
Refer to the Egress policy demo and API documentation on how to configure policies for routing egress traffic for various protocols.
2. Configuring mesh-wide Egress passthrough
Enabling mesh-wide Egress passthrough to external destinations
Egress can be enabled mesh-wide during FSM install or post install. When egress is enabled mesh-wide, outbound traffic from pods are allowed to egress the pod as long as the traffic does not match in-mesh traffic policies that otherwise deny the traffic.
During FSM installation, the egress feature is enabled by default. You can disabled via options as below.
fsm install --set fsm.enableEgress=falseAfter FSM has been installed:
fsm-controllerretrieves the egress configuration from thefsm-mesh-configMeshConfigcustom resource in the fsm mesh control plane namespace (fsm-systemby default). Usekubectl patchto setenableEgresstotruein thefsm-mesh-configresource.# Replace fsm-system with the namespace where FSM is installed kubectl patch meshconfig fsm-mesh-config -n fsm-system -p '{"spec":{"traffic":{"enableEgress":true}}}' --type=mergeWith kubectl patching, it could be disabled too.
Disabling mesh-wide Egress passthrough to external destinations
Similar to enabling egress, mesh-wide egress can be disabled during FSM install or post install.
During FSM install:
fsm install --set fsm.enableEgress=falseAfter FSM has been installed: Use
kubectl patchto setenableEgresstofalsein thefsm-mesh-configresource.# Replace fsm-system with the namespace where FSM is installed kubectl patch meshconfig fsm-mesh-config -n fsm-system -p '{"spec":{"traffic":{"enableEgress":false}}}' --type=merge
With egress disabled, traffic from pods within the mesh will not be able to access external services outside the cluster.
How it works
When egress is enabled mesh-wide, FSM controller programs every Pipy proxy sidecar in the mesh with a wildcard rule that matches outbound destinations that do not correspond to in-mesh services. The wildcard rule that matches such external traffic simply proxies the traffic as is to its original destination without subjecting them to L4 or L7 traffic policies.
FSM supports egress for traffic that uses TCP as the underlying transport. This includes raw TCP traffic, HTTP, HTTPS, gRPC etc.
Since mesh-wide egress is a global setting and operates as a passthrough to unknown destinations, fine grained access control (such as applying TCP or HTTP routing policies) over egress traffic is not possible.
Refer to the Egress passthrough demo to learn more.
Pipy configurations
When egress is enabled globally in the mesh, the FSM controller issues the following configuration for each Pipy proxy sidecar.
{
"Spec": {
"SidecarLogLevel": "error",
"Traffic": {
"EnableEgress": true
}
}
}
The Pipy script for EnableEgress=true will use the original destination logic to route the request to proxy it to the original destination.
3.8.2 - Egress Gateway
Egress Gateway
Egress gateway is another approach to manage access to services external to the service mesh.
In this mode, the sidecar forwards egress traffic to the Egress gateway, and Egress gateway completes the forwarding to external services.
Using an Egress Gateway provides unified egress management, although it is an extra hop from the network perspective. The security team can set network rules on a fixed device to allow access to external services. The node selector is then used when the egress gateway is dispatched to these devices. Both approaches have their advantages and disadvantages and need to be chosen based on specific scenarios.
Configuration Egress Gateway
Egress gateway also supports the enable and disable mesh-wide passthrough, you can refer to configuration section of Egress.
First of all, it’s required to deploy the egress gateway. Refer to Egress Gateway Demo for egress gateway installation.
Once we have the gateway, we need to add a global egress policy. The spec of EgressGateway declares that egress traffic can be forwarded to the Service global-egress-gateway under the namespace egress-gateway.
kind: EgressGateway
apiVersion: policy.flomesh.io/v1alpha1
metadata:
name: global-egress-gateway
namespace: fsm
spec:
global:
- service: fsm-egress-gateway
namespace: fsm
global-egress-gateway created above is a global egress gateway. By default, all egress traffic will be redirected to this global egress gateway by sidecar.
More configuration for Egress gateway
As we know, the sidecar will forward egress traffic to egress gateway and the latter one will complete the forwarding to services external to mesh.
The transmission between sidecar and egress gateway has two modes: http2tunnel and socks5. This can be set during the deployment of egress gateway and it will use http2tunnel if omitted.
Demo
To learn more about configuration for egress gateway, refer to following demo guides:
3.9 - Multi-cluster services
Multi-cluster communication with Flomesh Service Mesh
Kubernetes has been quite successful in popularizing the idea of container clusters. Deployments have reached a point where many users are running multiple clusters and struggling to keep them running smoothly. Organizations need to run multiple Kubernetes clusters might fall into one of the below reasons (not an exhaustive list):
- Location
- Latency (run the application as close to customers as possible)
- Jurisdiction (e.g. required to keep user data in-country)
- Data gravity (e.g. data exists in one provider)
- Isolation
- Environment (e.g. development, testing, staging, prod, etc)
- Performance isolation (teams don’t want to feel each other)
- Security isolation (sensitive data or untrusted code)
- Organizational isolation (teams have different management domains)
- Cost isolation (teams want to get different bills)
- Reliability
- Blast radius (an infra or app problem in one cluster doesn’t kill the whole system)
- Infrastructure diversity (an underlying zone, region, or provider outages does not bring down the whole system)
- Scale (the app is too big to fit in a single cluster)
- Upgrade scope (upgrade infra for some parts of your app but not all of it; avoid the need for in-place cluster upgrades)
There is currently no standard way to connect or even think about Kubernetes services beyond the single cluster boundary, and Kubernetes Multicluster SIG has put together a proposal KEP-1645 to extend Kubernetes Service concepts across multiple clusters.
Flomesh team has been spending time tackling the challenge of multicluster communication, integrating north-south traffic management capabilities into FSM SMI compatible service mesh, and contributing back to the Open Source community.
In this part of the series, we will be looking into motivation, goals, architecture of FSM multi-cluster support, its components.
Motivation
During our consultancy and support to the community, commercial clients, and enterprises we have seen multiple requests and desires (a few of which are cited above) on why they want to split their deployments across multiple clusters while maintaining mutual dependencies between workloads operating in those clusters. Currently, the cluster is a hard boundary, and service is opaque to a distant K8s consumer who may otherwise use metadata (e.g. endpoint topology) to better direct traffic. Users may want to use services distributed across clusters to support failover or temporarily during migration, however, this needs non-trivial customized solutions today.
Flomesh team aims to help the community by providing solutions to these problems.
Goals
- Define a minimal API to support service discovery and consumption across clusters.
- Consume a service in another cluster.
- Consume a service deployed in multiple clusters as a single service.
- When a service is consumed from another cluster its behavior should be predictable and consistent with how it would be consumed within its cluster.
- Allow gradual rollout of changes in a multi-cluster environment.
- Provide a stand-alone implementation that can be used without any coupling to any product and/or solution.
- Transparent integration with FSM service mesh, for users who want to have multi-cluster support with service mesh functionality.
- Fully open source and welcomes the community to participate and contribute.
Architecture
- Control plane
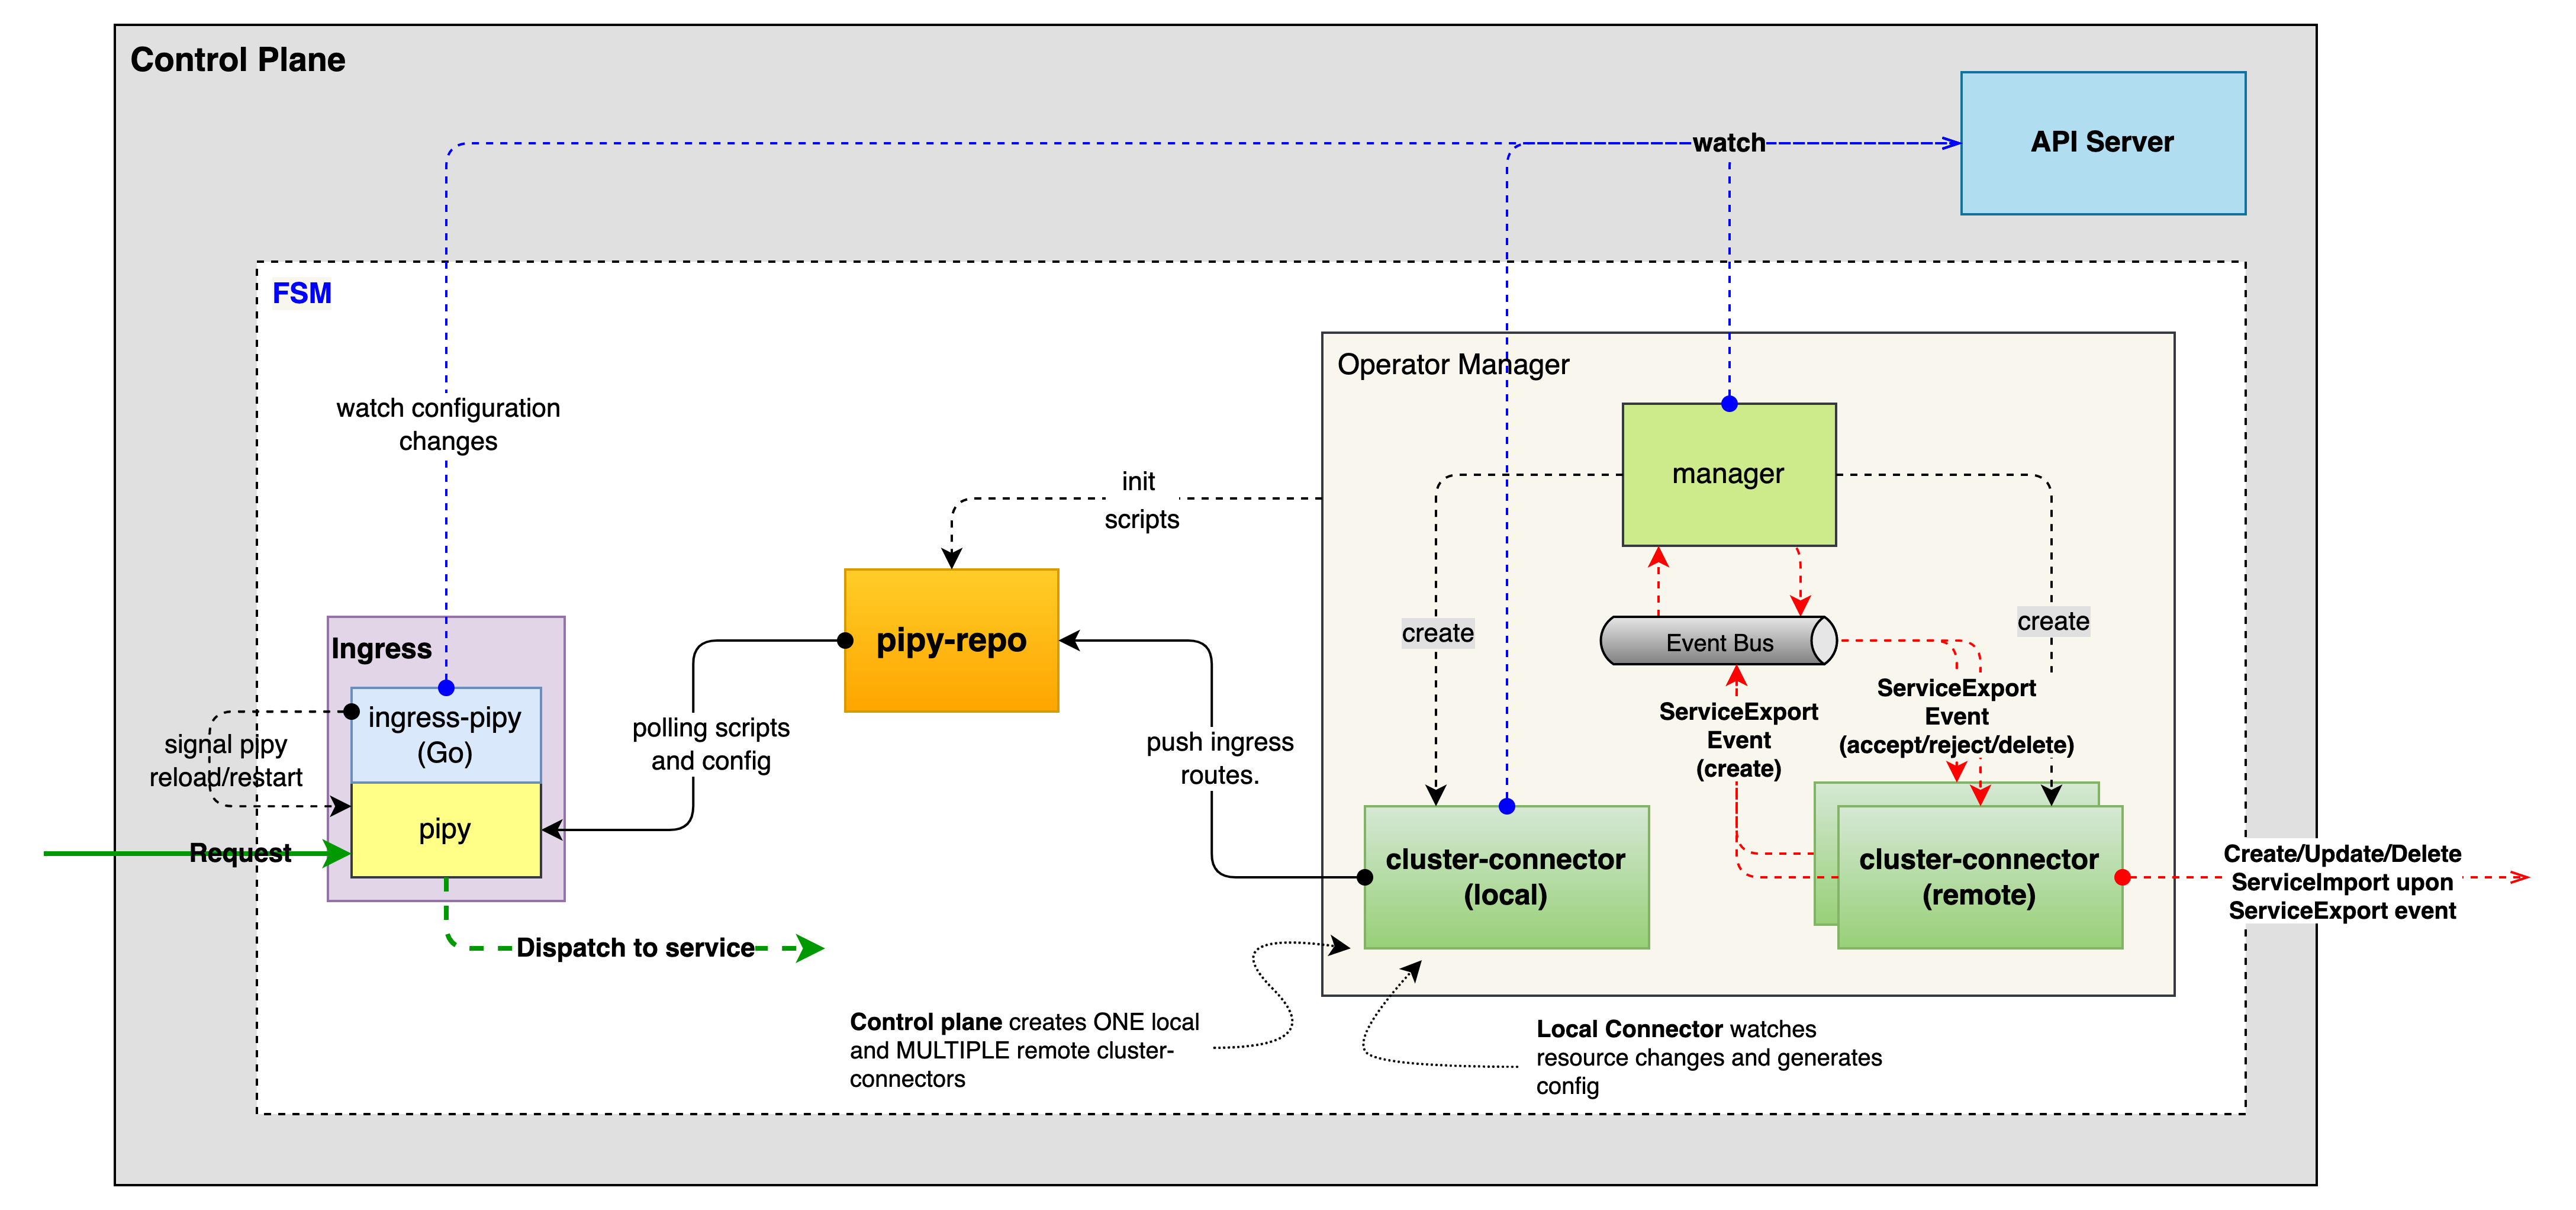
- fsm integration (managed cluster)
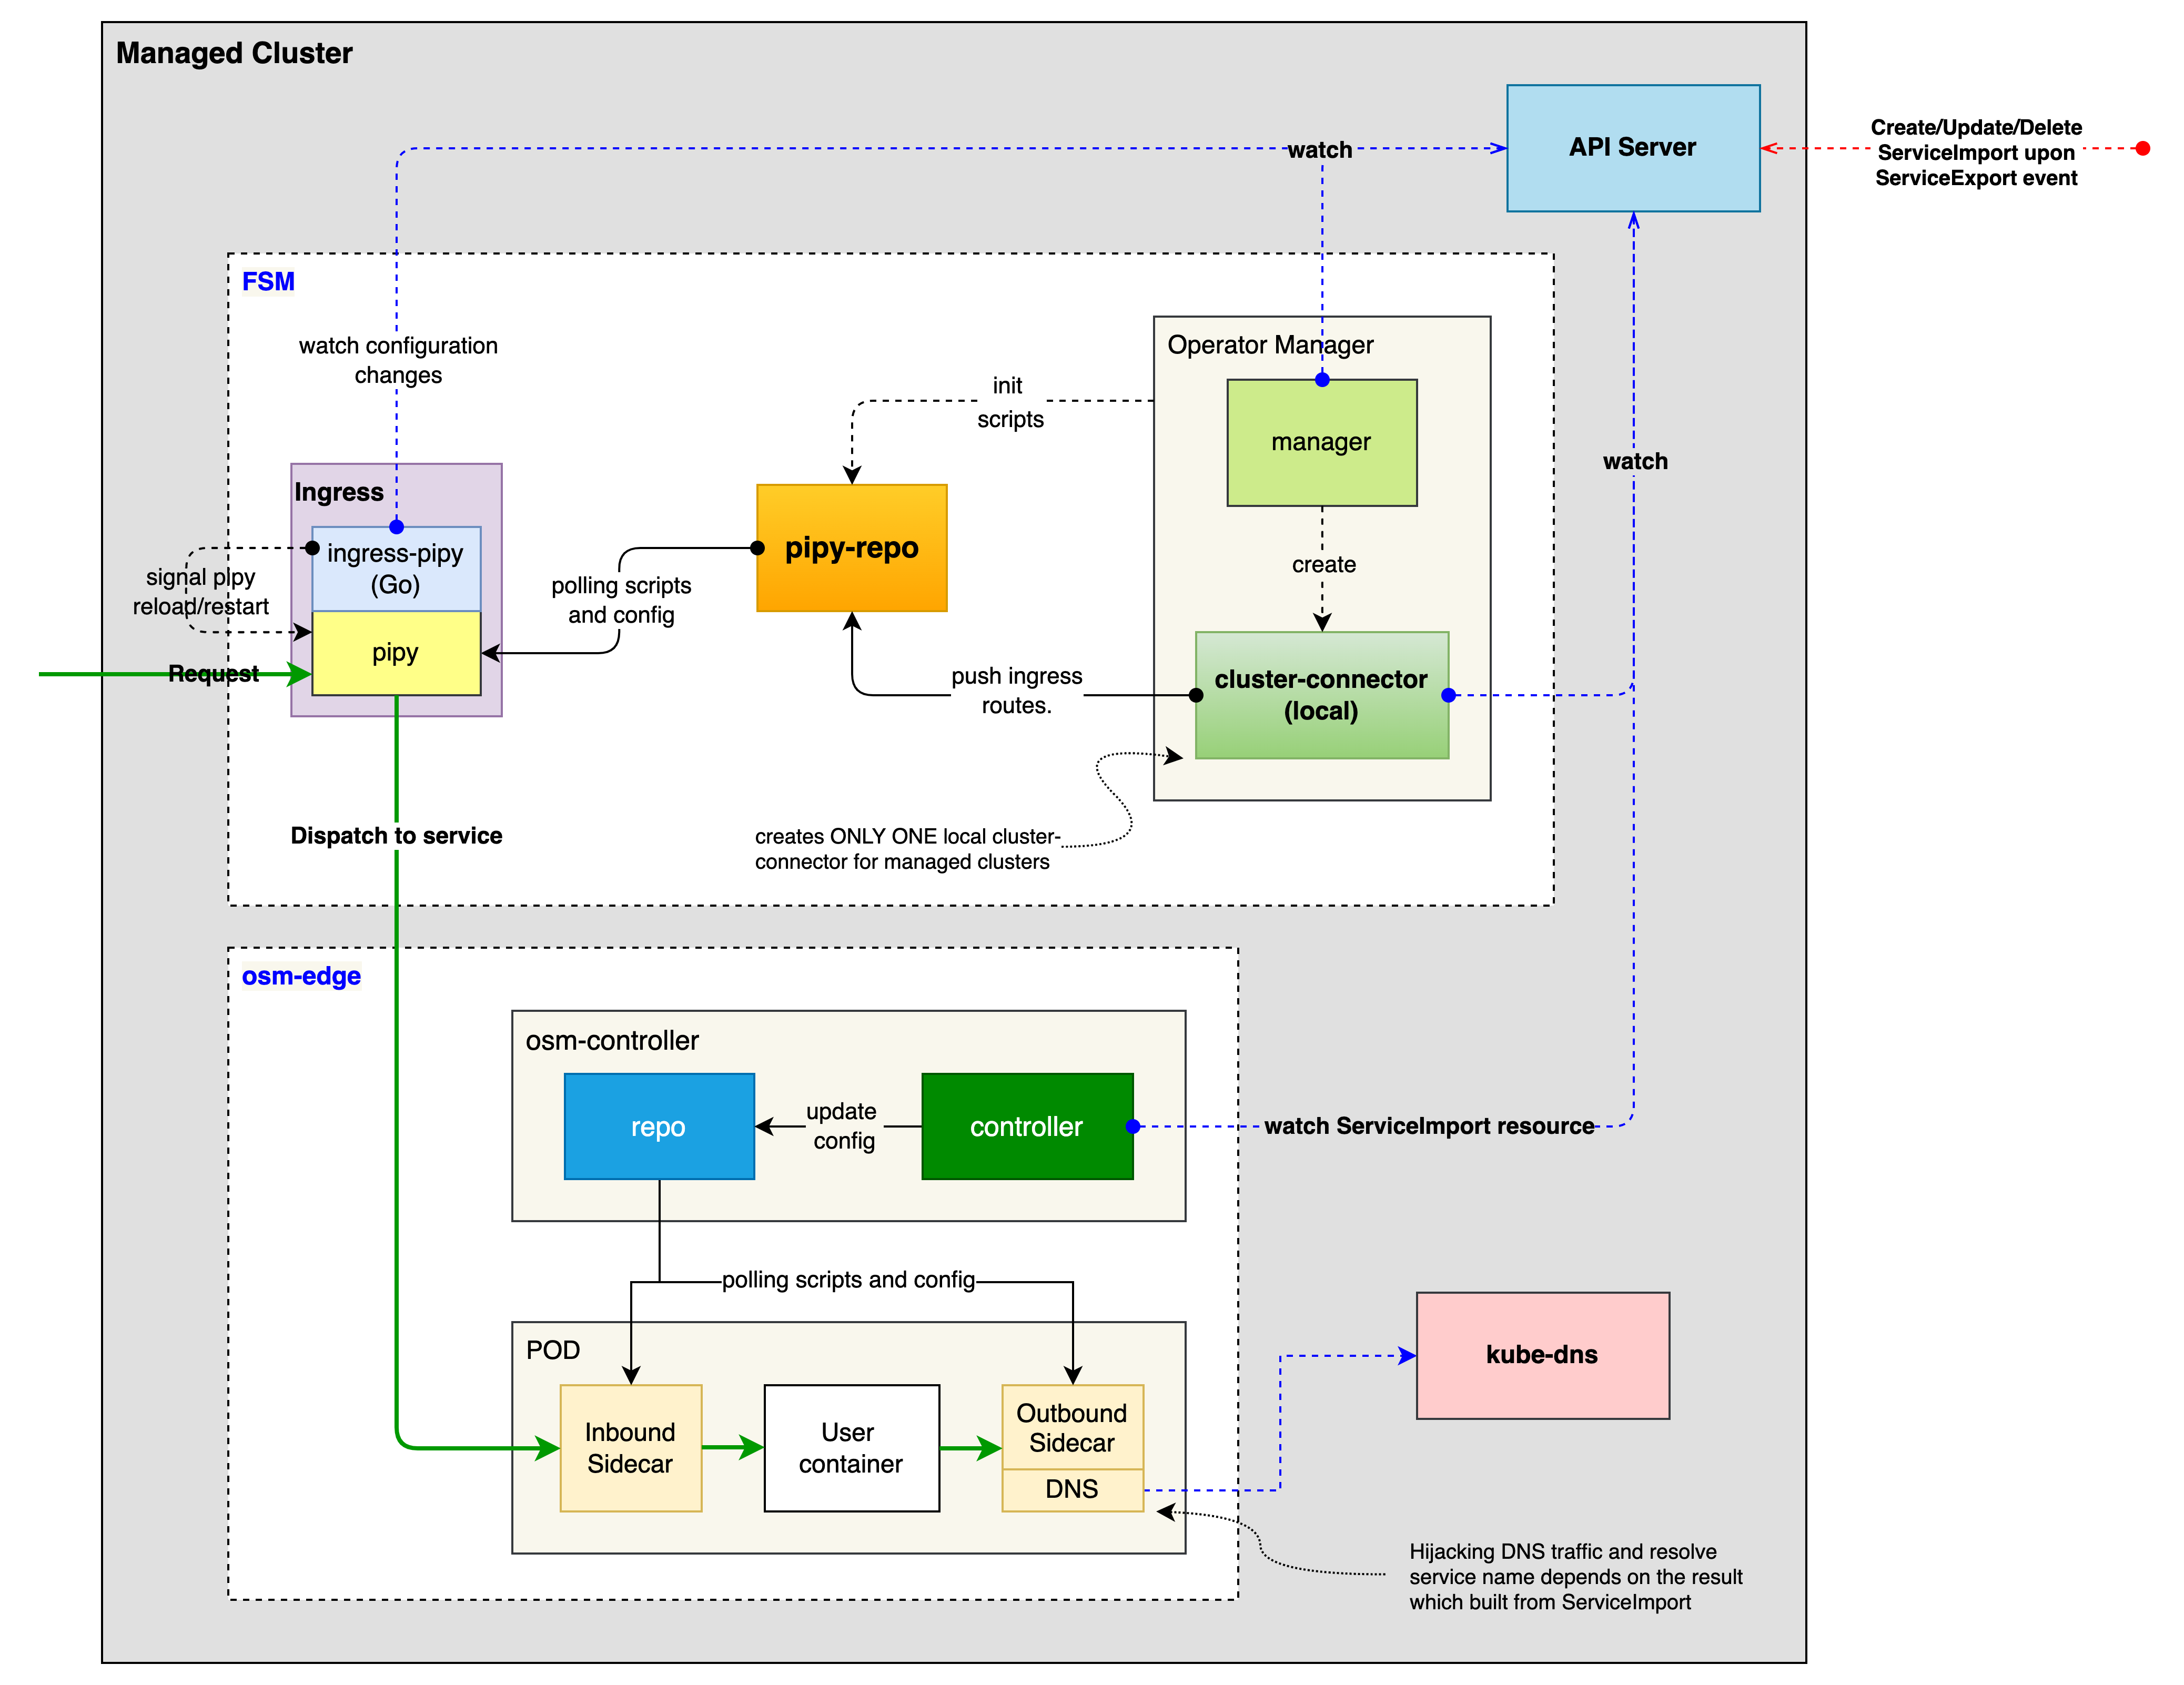
FSM provides a set of Kubernetes custom resources (CRD) for cluster connector, and make use of KEP-1645 ServiceExport and ServiceImport API for exporting and importing services. So let’s take a quick look at them
Cluster CRD
When registering a cluster, we provide the following information.
- The address (e.g.
gatewayHost: cluster-A.host) and port (e.g.gatewayPort: 80) of the cluster kubeconfigto access the cluster, containing the api-server address and information such as the certificate and secret key
apiVersion: flomesh.io/v1alpha1
kind: Cluster
metadata:
name: cluster-A
spec:
gatewayHost: cluster-A.host
gatewayPort: 80
kubeconfig: |+
---
apiVersion: v1
clusters:
- cluster:
certificate-authority-data:
server: https://cluster-A.host:6443
name: cluster-A
contexts:
- context:
cluster: cluster-A
user: admin@cluster-A
name: cluster-A
current-context: cluster-A
kind: Config
preferences: {}
users:
- name: admin@cluster-A
user:
client-certificate-data:
client-key-data:
ServiceExport and ServiceImport CRD
For cross-cluster service registration, FSM provides the ServiceExport and ServiceImport CRDs from KEP-1645: Multi-Cluster Services API for ServiceExports.flomesh.io and ServiceImports.flomesh.io. The former is used to register services with the control plane and declare that the application can provide services across clusters, while the latter is used to reference services from other clusters.
For clusters cluster-A and cluster-B that join the cluster federation, a Service named foo exists under the namespace bar of cluster cluster-A and a ServiceExport foo of the same name is created under the same namespace. A ServiceImport resource with the same name is automatically created under the namespace bar of cluster cluster-B (if it does not exist, it is automatically created).
// in cluster-A
apiVersion: v1
kind: Service
metadata:
name: foo
namespace: bar
spec:
ports:
- port: 80
selector:
app: foo
---
apiVersion: flomesh.io/v1alpha1
kind: ServiceExport
metadata:
name: foo
namespace: bar
---
// in cluster-B
apiVersion: flomesh.io/v1alpha1
kind: ServiceImport
metadata:
name: foo
namespace: bar
The YAML snippet above shows how to register the foo service to the control plane of a multi-cluster. In the following, we will walk through a slightly more complex scenario of cross-cluster service registration and traffic scheduling.
Okay that was a quick introduction to the CRDs, so let’s continue with our demo.
For detailed CRD reference, refer to Multicluster API Reference
Demo
4 - Observability
4.1 - Metrics
FSM generates detailed metrics related to all traffic within the mesh and the FSM control plane. These metrics provide insights into the behavior of applications in the mesh and the mesh itself helping users to troubleshoot, maintain and analyze their applications.
FSM collects metrics directly from the sidecar proxies (Pipy). With these metrics the user can get information about the overall volume of traffic, errors within traffic and the response time for requests.
Additionally, FSM generates metrics for the control plane components. These metrics can be used to monitor the behavior and health of the service mesh.
FSM uses Prometheus to gather and store consistent traffic metrics and statistics for all applications running in the mesh. Prometheus is an open-source monitoring and alerting toolkit which is commonly used on (but not limited to) Kubernetes and Service Mesh environments.
Each application that is part of the mesh runs in a Pod which contains an Pipy sidecar that exposes metrics (proxy metrics) in the Prometheus format. Furthermore, every Pod that is a part of the mesh and in a namespace with metrics enabled has Prometheus annotations, which makes it possible for the Prometheus server to scrape the application dynamically. This mechanism automatically enables scraping of metrics whenever a pod is added to the mesh.
FSM metrics can be viewed with Grafana which is an open source visualization and analytics software. It allows you to query, visualize, alert on, and explore your metrics.
Grafana uses Prometheus as backend timeseries database. If Grafana and Prometheus are chosen to be deployed through FSM installation, necessary rules will be set upon deployment for them to interact. Conversely, on a “Bring-Your-Own” or “BYO” model (further explained below), installation of these components will be taken care of by the user.
Installing Metrics Components
FSM can either provision Prometheus and Grafana instances at install time or FSM can connect to an existing Prometheus and/or Grafana instance. We call the latter pattern “Bring-Your-Own” or “BYO”. The sections below describe how to configure metrics by allowing FSM to automatically provision the metrics components and with the BYO method.
Automatic Provisioning
By default, both Prometheus and Grafana are disabled.
However, when configured with the --set=fsm.deployPrometheus=true flag, FSM installation will deploy a Prometheus instance to scrape the sidecar’s metrics endpoints. Based on the metrics scraping configuration set by the user, FSM will annotate pods part of the mesh with necessary metrics annotations to have Prometheus reach and scrape the pods to collect relevant metrics. The scraping configuration file defines the default Prometheus behavior and the set of metrics collected by FSM.
To install Grafana for metrics visualization, pass the --set=fsm.deployGrafana=true flag to the fsm install command. FSM provides a pre-configured dashboard that is documented in FSM Grafana dashboards.
fsm install --set=fsm.deployPrometheus=true \
--set=fsm.deployGrafana=true
Note: The Prometheus and Grafana instances deployed automatically by FSM have simple configurations that do not include high availability, persistent storage, or locked down security. If production-grade instances are required, pre-provision them and follow the BYO instructions on this page to integrate them with FSM.
Bring-Your-Own
Prometheus
The following section documents the additional steps needed to allow an already running Prometheus instance to poll the endpoints of an FSM mesh.
List of Prerequisites for BYO Prometheus
- Already running an accessible Prometheus instance outside of the mesh.
- A running FSM control plane instance, deployed without metrics stack.
- We will assume having Grafana reach Prometheus, exposing or forwarding Prometheus or Grafana web ports and configuring Prometheus to reach Kubernetes API services is taken care of or otherwise out of the scope of these steps.
Configuration
- Make sure the Prometheus instance has appropriate RBAC rules to be able to reach both the pods and Kubernetes API - this might be dependent on specific requirements and situations for different deployments:
- apiGroups: [""]
resources: ["nodes", "nodes/proxy", "nodes/metrics", "services", "endpoints", "pods", "ingresses", "configmaps"]
verbs: ["list", "get", "watch"]
- apiGroups: ["extensions"]
resources: ["ingresses", "ingresses/status"]
verbs: ["list", "get", "watch"]
- nonResourceURLs: ["/metrics"]
verbs: ["get"]
- If desired, use the Prometheus Service definition to allow Prometheus to scrape itself:
annotations:
prometheus.io/scrape: "true"
prometheus.io/port: "<API port for prometheus>" # Depends on deployment - FSM automatic deployment uses 7070 by default, controlled by `values.yaml`
- Amend Prometheus’ configmap to reach the pods/Pipy endpoints. FSM automatically appends the port annotations to the pods and takes care of pushing the listener configuration to the pods for Prometheus to reach:
- job_name: 'kubernetes-pods'
kubernetes_sd_configs:
- role: pod
relabel_configs:
- source_labels: [__meta_kubernetes_pod_annotation_prometheus_io_scrape]
action: keep
regex: true
- source_labels: [__meta_kubernetes_pod_annotation_prometheus_io_path]
action: replace
target_label: __metrics_path__
regex: (.+)
- source_labels: [__address__, __meta_kubernetes_pod_annotation_prometheus_io_port]
action: replace
regex: ([^:]+)(?::\d+)?;(\d+)
replacement: $1:$2
target_label: __address__
- source_labels: [__meta_kubernetes_namespace]
action: replace
target_label: source_namespace
- source_labels: [__meta_kubernetes_pod_name]
action: replace
target_label: source_pod_name
- regex: '(__meta_kubernetes_pod_label_app)'
action: labelmap
replacement: source_service
- regex: '(__meta_kubernetes_pod_label_fsm_sidecar_uid|__meta_kubernetes_pod_label_pod_template_hash|__meta_kubernetes_pod_label_version)'
action: drop
- source_labels: [__meta_kubernetes_pod_controller_kind]
action: replace
target_label: source_workload_kind
- source_labels: [__meta_kubernetes_pod_controller_name]
action: replace
target_label: source_workload_name
- source_labels: [__meta_kubernetes_pod_controller_kind]
action: replace
regex: ^ReplicaSet$
target_label: source_workload_kind
replacement: Deployment
- source_labels:
- __meta_kubernetes_pod_controller_kind
- __meta_kubernetes_pod_controller_name
action: replace
regex: ^ReplicaSet;(.*)-[^-]+$
target_label: source_workload_name
Grafana
The following section assumes a Prometheus instance has already been configured as a data source for a running Grafana instance. Refer to the Prometheus and Grafana demo for an example on how to create and configure a Grafana instance.
Importing FSM Dashboards
FSM Dashboards are available through our repository, which can be imported as json blobs on the web admin portal.
Detailed instructions for importing FSM dashboards can be found in the Prometheus and Grafana demo. Refer to FSM Grafana dashboard for an overview of the pre-configured dashboards.
Metrics scraping
Metrics scraping can be configured using the fsm metrics command. By default, FSM does not configure metrics scraping for pods in the mesh. Metrics scraping can be enabled or disabled at namespace scope such that pods belonging to configured namespaces can be enabled or disabled for scraping metrics.
For metrics to be scraped, the following prerequisites must be met:
- The namespace must be a part of the mesh, ie. it must be labeled with the
flomesh.io/monitored-bylabel with an appropriate mesh name. This can be done using thefsm namespace addcommand. - A running service able to scrape Prometheus endpoints. FSM provides configuration for an automatic bringup of Prometheus; alternatively users can bring their own Prometheus.
To enable one or more namespaces for metrics scraping:
fsm metrics enable --namespace test
fsm metrics enable --namespace "test1, test2"
To disable one or more namespaces for metrics scraping:
fsm metrics disable --namespace test
fsm metrics disable --namespace "test1, test2"
Enabling metrics scraping on a namespace also causes the fsm-injector to add the following annotations to pods in that namespace:
prometheus.io/scrape: true
prometheus.io/port: 15010
prometheus.io/path: /stats/prometheus
Available Metrics
FSM exports metrics about the traffic within the mesh as well as metrics about the control plane.
Custom Pipy Metrics
To implement the SMI Metrics Specification, the Pipy proxy in FSM generates the following statistics for HTTP traffic
fsm_request_total: a counter metric that is self-incrementing with each proxy request. By querying this metric, you can see the success and failure rates of requests for the services in the mesh.
fsm_request_duration_ms: A histogram metric that indicates the duration of a proxy request in milliseconds. This metric is queried to understand the latency between services in the mesh.
Both metrics have the following labels.
source_kind: the Kubernetes resource type of the workload that generated the request, e.g. Deployment, DaemonSet, etc.
destination_kind: The Kubernetes resource type that processes the requested workload, e.g. Deployment, DaemonSet, etc.
source_name: The name of the Kubernetes that generated the requested workload.
destination_name: The name of the Kubernetes that processed the requested workload.
source_pod: the name of the pod in Kubernetes that generated the request.
destination_pod: the name of the pod that processed the request in Kubernetes.
source_namespace: the namespace in Kubernetes of the workload that generated the request.
destination_namespace: the namespace in Kubernetes of the workload that processed the request.
In addition, the fsm_request_total metric has a response_code tag that indicates the HTTP status code of the request, e.g. 200, 404, etc.
Control Plane
The following metrics are exposed in the Prometheus format by the FSM control plane components. The fsm-controller and fsm-injector pods have the following Prometheus annotation.
annotations:
prometheus.io/scrape: 'true'
prometheus.io/port: '9091'
| Metric | Type | Labels | Description |
|---|---|---|---|
| fsm_k8s_api_event_count | Count | type, namespace | Number of events received from the Kubernetes API Server |
| fsm_proxy_connect_count | Gauge | Number of proxies connected to FSM controller | |
| fsm_proxy_reconnect_count | Count | IngressGateway defines the certificate specification for an ingress gateway | |
| fsm_proxy_response_send_success_count | Count | proxy_uuid, identity, type | Number of responses successfully sent to proxies |
| fsm_proxy_response_send_error_count | Count | proxy_uuid, identity, type | Number of responses that errored when being set to proxies |
| fsm_proxy_config_update_time | Histogram | resource_type, success | Histogram to track time spent for proxy configuration |
| fsm_proxy_broadcast_event_count | Count | Number of ProxyBroadcast events published by the FSM controller | |
| fsm_proxy_xds_request_count | Count | proxy_uuid, identity, type | Number of XDS requests made by proxies |
| fsm_proxy_max_connections_rejected | Count | Number of proxy connections rejected due to the configured max connections limit | |
| fsm_cert_issued_count | Count | Total number of XDS certificates issued to proxies | |
| fsm_cert_issued_time | Histogram | Histogram to track time spent to issue xds certificate | |
| fsm_admission_webhook_response_total | Count | kind, success | Total number of admission webhook responses generated |
| fsm_error_err_code_count | Count | err_code | Number of errcodes generated by FSM |
| fsm_http_response_total | Count | code, method, path | Number of HTTP responses sent |
| fsm_http_response_duration | Histogram | code, method, path | Duration in seconds of HTTP responses sent |
| fsm_feature_flag_enabled | Gauge | feature_flag | Represents whether a feature flag is enabled (1) or disabled (0) |
| fsm_conversion_webhook_resource_total | Count | kind, success, from_version, to_version | Number of resources converted by conversion webhooks |
| fsm_events_queued | Gauge | Number of events seen but not yet processed by the control plane | |
| fsm_reconciliation_total | Count | kind | Counter of resource reconciliations invoked |
Error Code Metrics
When an error occurs in the FSM control plane the ErrCodeCounter Prometheus metric is incremented for the related FSM error code. For the complete list of error codes and their descriptions, see FSM Control Plane Error Code Troubleshooting Guide.
The fully-qualified name of the error code metric is fsm_error_err_code_count.
Note: Metrics corresponding to errors that result in process restarts might not be scraped in time.
Query metrics from Prometheus
Before you begin
Ensure that you have followed the steps to run FSM Demo
Querying proxy metrics for request count
- Verify that the Prometheus service is running in your cluster
- In kubernetes, execute the following command:
kubectl get svc fsm-prometheus -n <fsm-namespace>.
- Note:
<fsm-namespace>refers to the namespace where the fsm control plane is installed.
- In kubernetes, execute the following command:
- Open up the Prometheus UI
- Ensure you are in root of the repository and execute the following script:
./scripts/port-forward-prometheus.sh - Visit the following url http://localhost:7070 in your web browser
- Ensure you are in root of the repository and execute the following script:
- Execute a Prometheus query
- In the “Expression” input box at the top of the web page, enter the text:
sidecar_cluster_upstream_rq_xx{sidecar_response_code_class="2"}and click the execute button - This query will return the successful http requests
- In the “Expression” input box at the top of the web page, enter the text:
Sample result will be:
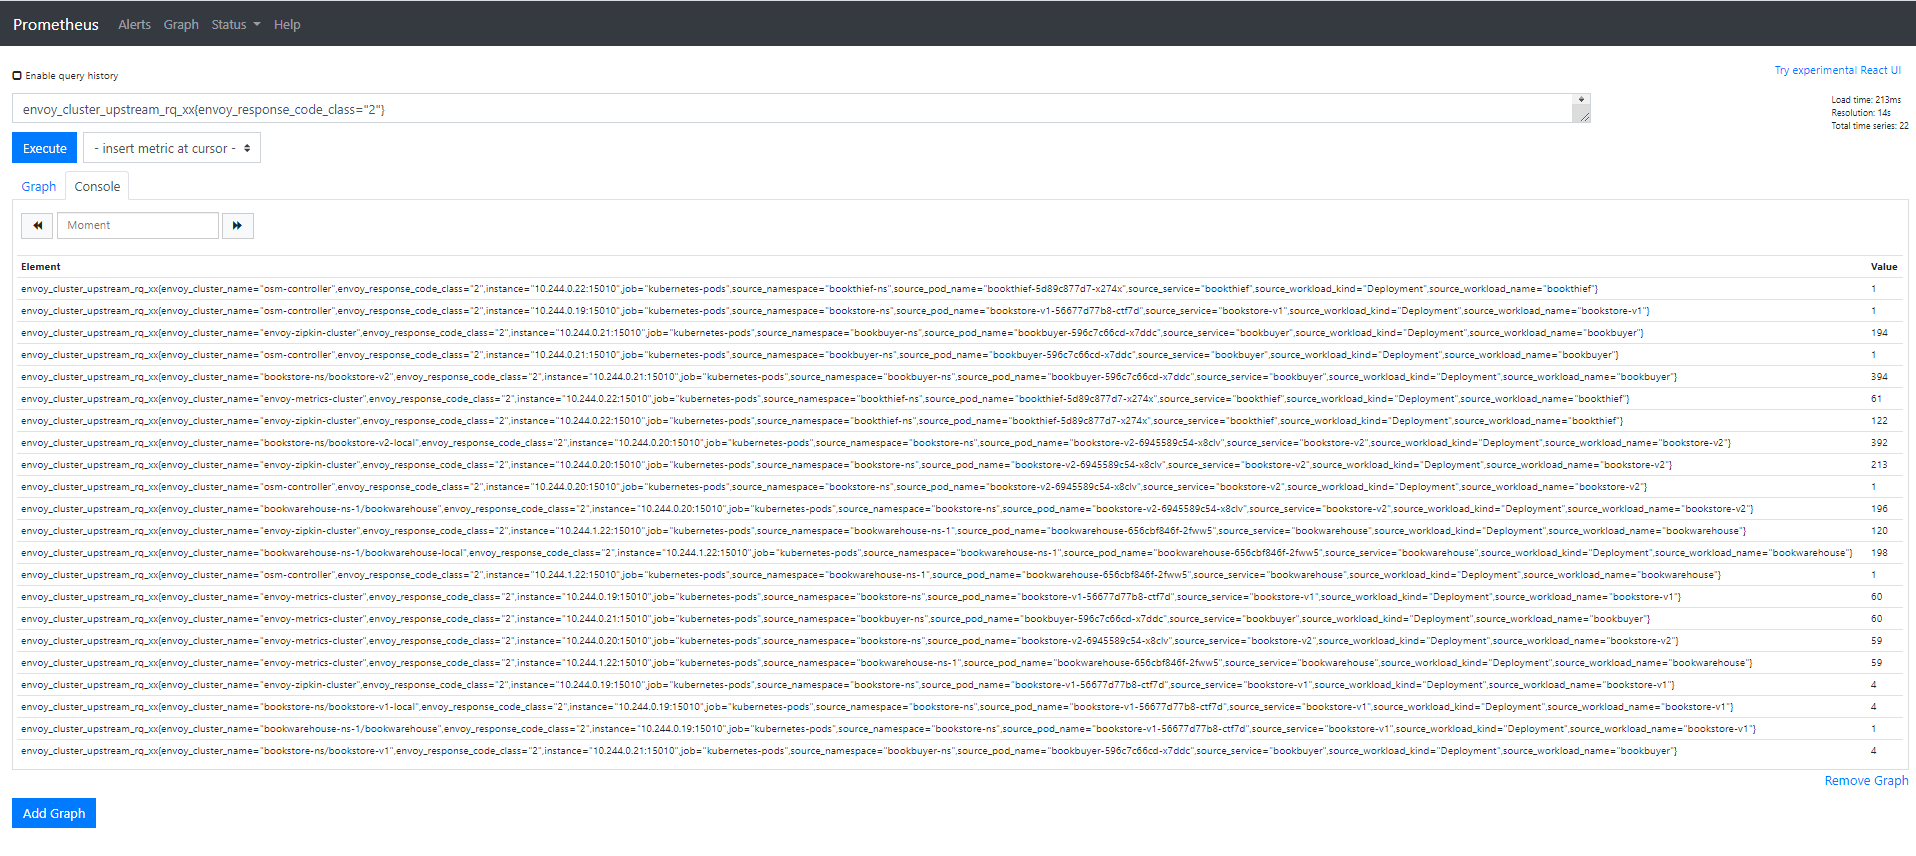
Visualize metrics with Grafana
List of Prerequisites for Viewing Grafana Dashboards
Ensure that you have followed the steps to run FSM Demo
Viewing a Grafana dashboard for service to service metrics
- Verify that the Prometheus service is running in your cluster
- In kubernetes, execute the following command:
kubectl get svc fsm-prometheus -n <fsm-namespace>
- In kubernetes, execute the following command:
- Verify that the Grafana service is running in your cluster
- In kubernetes, execute the following command:
kubectl get svc fsm-grafana -n <fsm-namespace>
- In kubernetes, execute the following command:
- Open up the Grafana UI
- Ensure you are in root of the repository and execute the following script:
./scripts/port-forward-grafana.sh - Visit the following url http://localhost:3000 in your web browser
- Ensure you are in root of the repository and execute the following script:
- The Grafana UI will request for login details, use the following default settings:
- username: admin
- password: admin
- Viewing Grafana dashboard for service to service metrics
- From the Grafana’s dashboards left hand corner navigation menu you can navigate to the FSM Service to Service Dashboard in the folder FSM Data Plane
- Or visit the following url http://localhost:3000/d/FSMs2sMetrics/fsm-service-to-service-metrics?orgId=1 in your web browser
FSM Service to Service Metrics dashboard will look like:
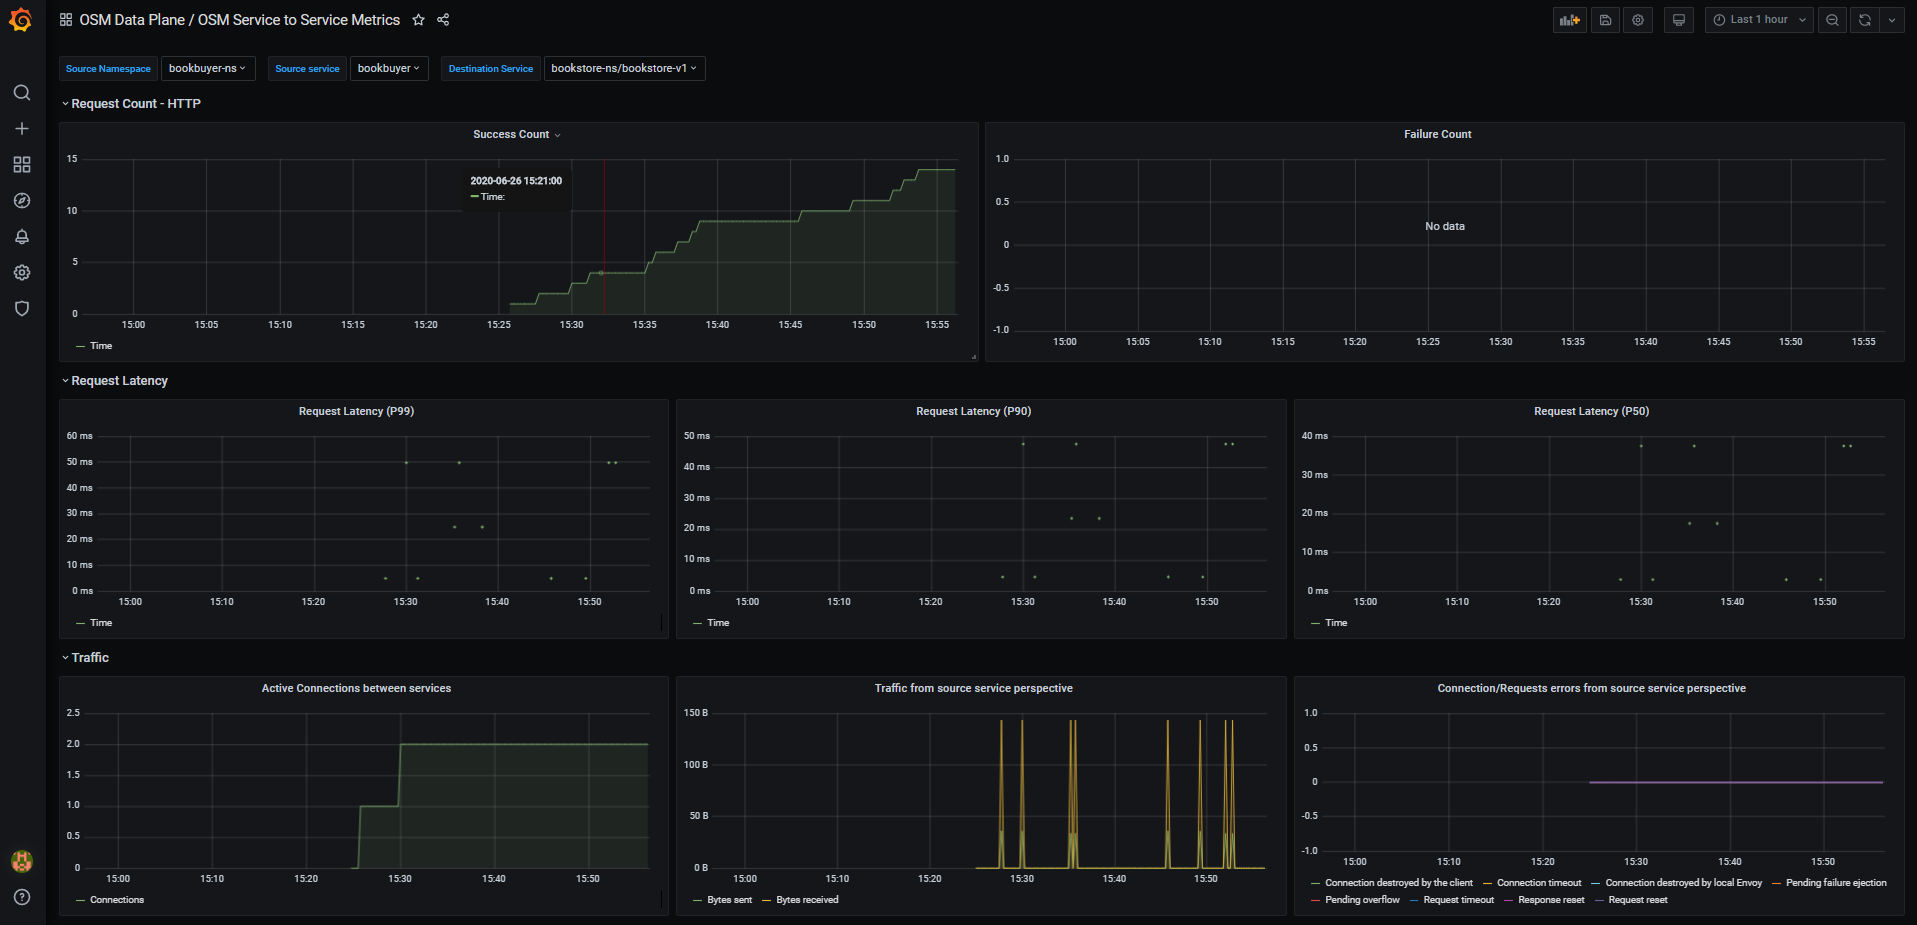
FSM Grafana dashboards
FSM provides some pre-cooked Grafana dashboards to display and track services related information captured by Prometheus:
FSM Data Plane
- FSM Data Plane Performance Metrics: This dashboard lets you view the performance of FSM’s data plane

- FSM Service to Service Metrics: This dashboard lets you view the traffic metrics from a given source service to a given destination service

- FSM Pod to Service Metrics: This dashboard lets you investigate the traffic metrics from a pod to all the services it connects/talks to

- FSM Workload to Service Metrics: This dashboard provides the traffic metrics from a workload (deployment, replicaSet) to all the services it connects/talks to

- FSM Workload to Workload Metrics: This dashboard displays the latencies of requests in the mesh from workload to workload

- FSM Data Plane Performance Metrics: This dashboard lets you view the performance of FSM’s data plane
FSM Control Plane
- FSM Control Plane Metrics: This dashboard provides traffic metrics from the given service to FSM’s control plane

- Mesh and Pipy Details: This dashboard lets you view the performance and behavior of FSM’s control plane

- FSM Control Plane Metrics: This dashboard provides traffic metrics from the given service to FSM’s control plane
4.2 - Tracing
FSM allows optional deployment of Jaeger for tracing. Similarly, tracing can be enabled and customized during installation (tracing section in values.yaml) or at runtime by editing the fsm-mesh-config custom resource. Tracing can be enabled, disabled and configured at any time to support BYO scenarios.
When FSM is deployed with tracing enabled, the FSM control plane will use the user-provided tracing information to direct the Pipy to send traces when and where appropriate. If tracing is enabled without user-provided values, it will use the defaults in values.yaml. The tracing-address value tells all Pipy injected by FSM the FQDN to send tracing information to.
FSM supports tracing with applications that use Zipkin protocol.
Jaeger
Jaeger is an open source distributed tracing system used for monitoring and troubleshooting distributed systems. It allows you to get fine-grained metrics and distributed tracing information across your setup so that you can observe which microservices are communicating, where requests are going, and how long they are taking. You can use it to inspect for specific requests and responses to see how and when they happen.
When tracing is enabled, Jaeger is capable of receiving spans from Pipy in the mesh that can then be viewed and queried on Jaeger’s UI via port-forwarding.
FSM CLI offers the capability to deploy a Jaeger instance with FSM’s installation, but bringing your own managed Jaeger and configuring FSM’s tracing to point to it later is also supported.
Automatically Provision Jaeger
By default, Jaeger deployment and tracing as a whole is disabled.
A Jaeger instance can be automatically deployed by using the --set=fsm.deployJaeger=true FSM CLI flag at install time. This will provision a Jaeger pod in the mesh namespace.
Additionally, FSM has to be instructed to enable tracing on the proxies; this is done via the tracing section on the MeshConfig.
The following command will both deploy Jaeger and configure the tracing parameters according to the address of the newly deployed instance of Jaeger during FSM installation:
fsm install --set=fsm.deployJaeger=true,fsm.tracing.enable=true
This default bring-up uses the All-in-one Jaeger executable that launches the Jaeger UI, collector, query, and agent.
BYO (Bring-your-own)
This section documents the additional steps needed to allow an already running instance of Jaeger to integrate with your FSM control plane.
NOTE: This guide outlines steps specifically for Jaeger but you may use your own tracing application instance with applicable values. FSM supports tracing with applications that use Zipkin protocol
Prerequisites
- A running Jaeger instance
- Getting started with Jaeger includes a sample app as a demo
Tracing Values
The sections below outline how to make required updates depending on whether you already already have FSM installed or are deploying tracing and Jaeger during FSM installation. In either case, the following tracing values in values.yaml are being updated to point to your Jaeger instance:
enable: set totrueto tell the Pipy connection manager to send tracing data to a specific address (cluster)address: set to the destination cluster of your Jaeger instanceport: set to the destination port for the listener that you intend to useendpoint: set to the destination’s API or collector endpoint where the spans will be sent to
a) Enable tracing after FSM control plane has already been installed
If you already have FSM running, tracing values must be updated in the FSM MeshConfig using:
# Tracing configuration with sample values
kubectl patch meshconfig fsm-mesh-config -n fsm-system -p '{"spec":{"observability":{"tracing":{"enable":true,"address": "jaeger.fsm-system.svc.cluster.local","port":9411,"endpoint":"/api/v2/spans"}}}}' --type=merge
You can verify these changes have been deployed by inspecting the fsm-mesh-config resource:
kubectl get meshconfig fsm-mesh-config -n fsm-system -o jsonpath='{.spec.observability.tracing}{"\n"}'
b) Enable tracing at FSM control plane install time
To deploy your own instance of Jaeger during FSM installation, you can use the --set flag as shown below to update the values:
fsm install --set fsm.tracing.enable=true,fsm.tracing.address=<tracing server hostname>,fsm.tracing.port=<tracing server port>,fsm.tracing.endpoint=<tracing server endpoint>
View the Jaeger UI with Port-Forwarding
Jaeger’s UI is running on port 16686. To view the web UI, you can use kubectl port-forward:
fsm_POD=$(kubectl get pods -n "$K8S_NAMESPACE" --no-headers --selector app=jaeger | awk 'NR==1{print $1}')
kubectl port-forward -n "$K8S_NAMESPACE" "$fsm_POD" 16686:16686
Navigate to http://localhost:16686/ in a web browser to view the UI.
Example of Tracing with Jaeger
This section walks through the process of creating a simple Jaeger instance and enabling tracing with Jaeger in FSM.
Run the FSM Demo with Jaeger deployed. You have two options:
For automatic provisioning of Jaeger, simply set
DEPLOY_JAEGERin your.envfile to trueFor bring-your-own, you can deploy the sample instance provided by Jaeger using the commands below. If you wish to bring up Jaeger in a different namespace, make sure to update it below.
Create the Jaeger service.
kubectl apply -f - <<EOF --- kind: Service apiVersion: v1 metadata: name: jaeger namespace: fsm-system labels: app: jaeger spec: selector: app: jaeger ports: - protocol: TCP # Service port and target port are the same port: 9411 type: ClusterIP EOFCreate the Jaeger deployment.
kubectl apply -f - <<EOF --- apiVersion: apps/v1 kind: Deployment metadata: name: jaeger namespace: fsm-system labels: app: jaeger spec: replicas: 1 selector: matchLabels: app: jaeger template: metadata: labels: app: jaeger spec: containers: - name: jaeger image: jaegertracing/all-in-one args: - --collector.zipkin.host-port=9411 imagePullPolicy: IfNotPresent ports: - containerPort: 9411 resources: limits: cpu: 500m memory: 512M requests: cpu: 100m memory: 256M EOF
Enable tracing and pass in applicable values. If you have installed Jaeger in a different namespace, replace
fsm-systembelow.kubectl patch meshconfig fsm-mesh-config -n fsm-system -p '{"spec":{"observability":{"tracing":{"enable":true,"address": "jaeger.fsm-system.svc.cluster.local","port":9411,"endpoint":"/api/v2/spans"}}}}' --type=mergeRefer to instructions above to view the web UI using port forwarding
In the browser, you should see a
Servicedropdown which allows you to select from the various applications deployed by the bookstore demo.a) Select a service to view all spans from it. For example, if you select
bookbuyerwith aLookbackof one hour, you can see its interactions withbookstore-v1andbookstore-v2sorted by time.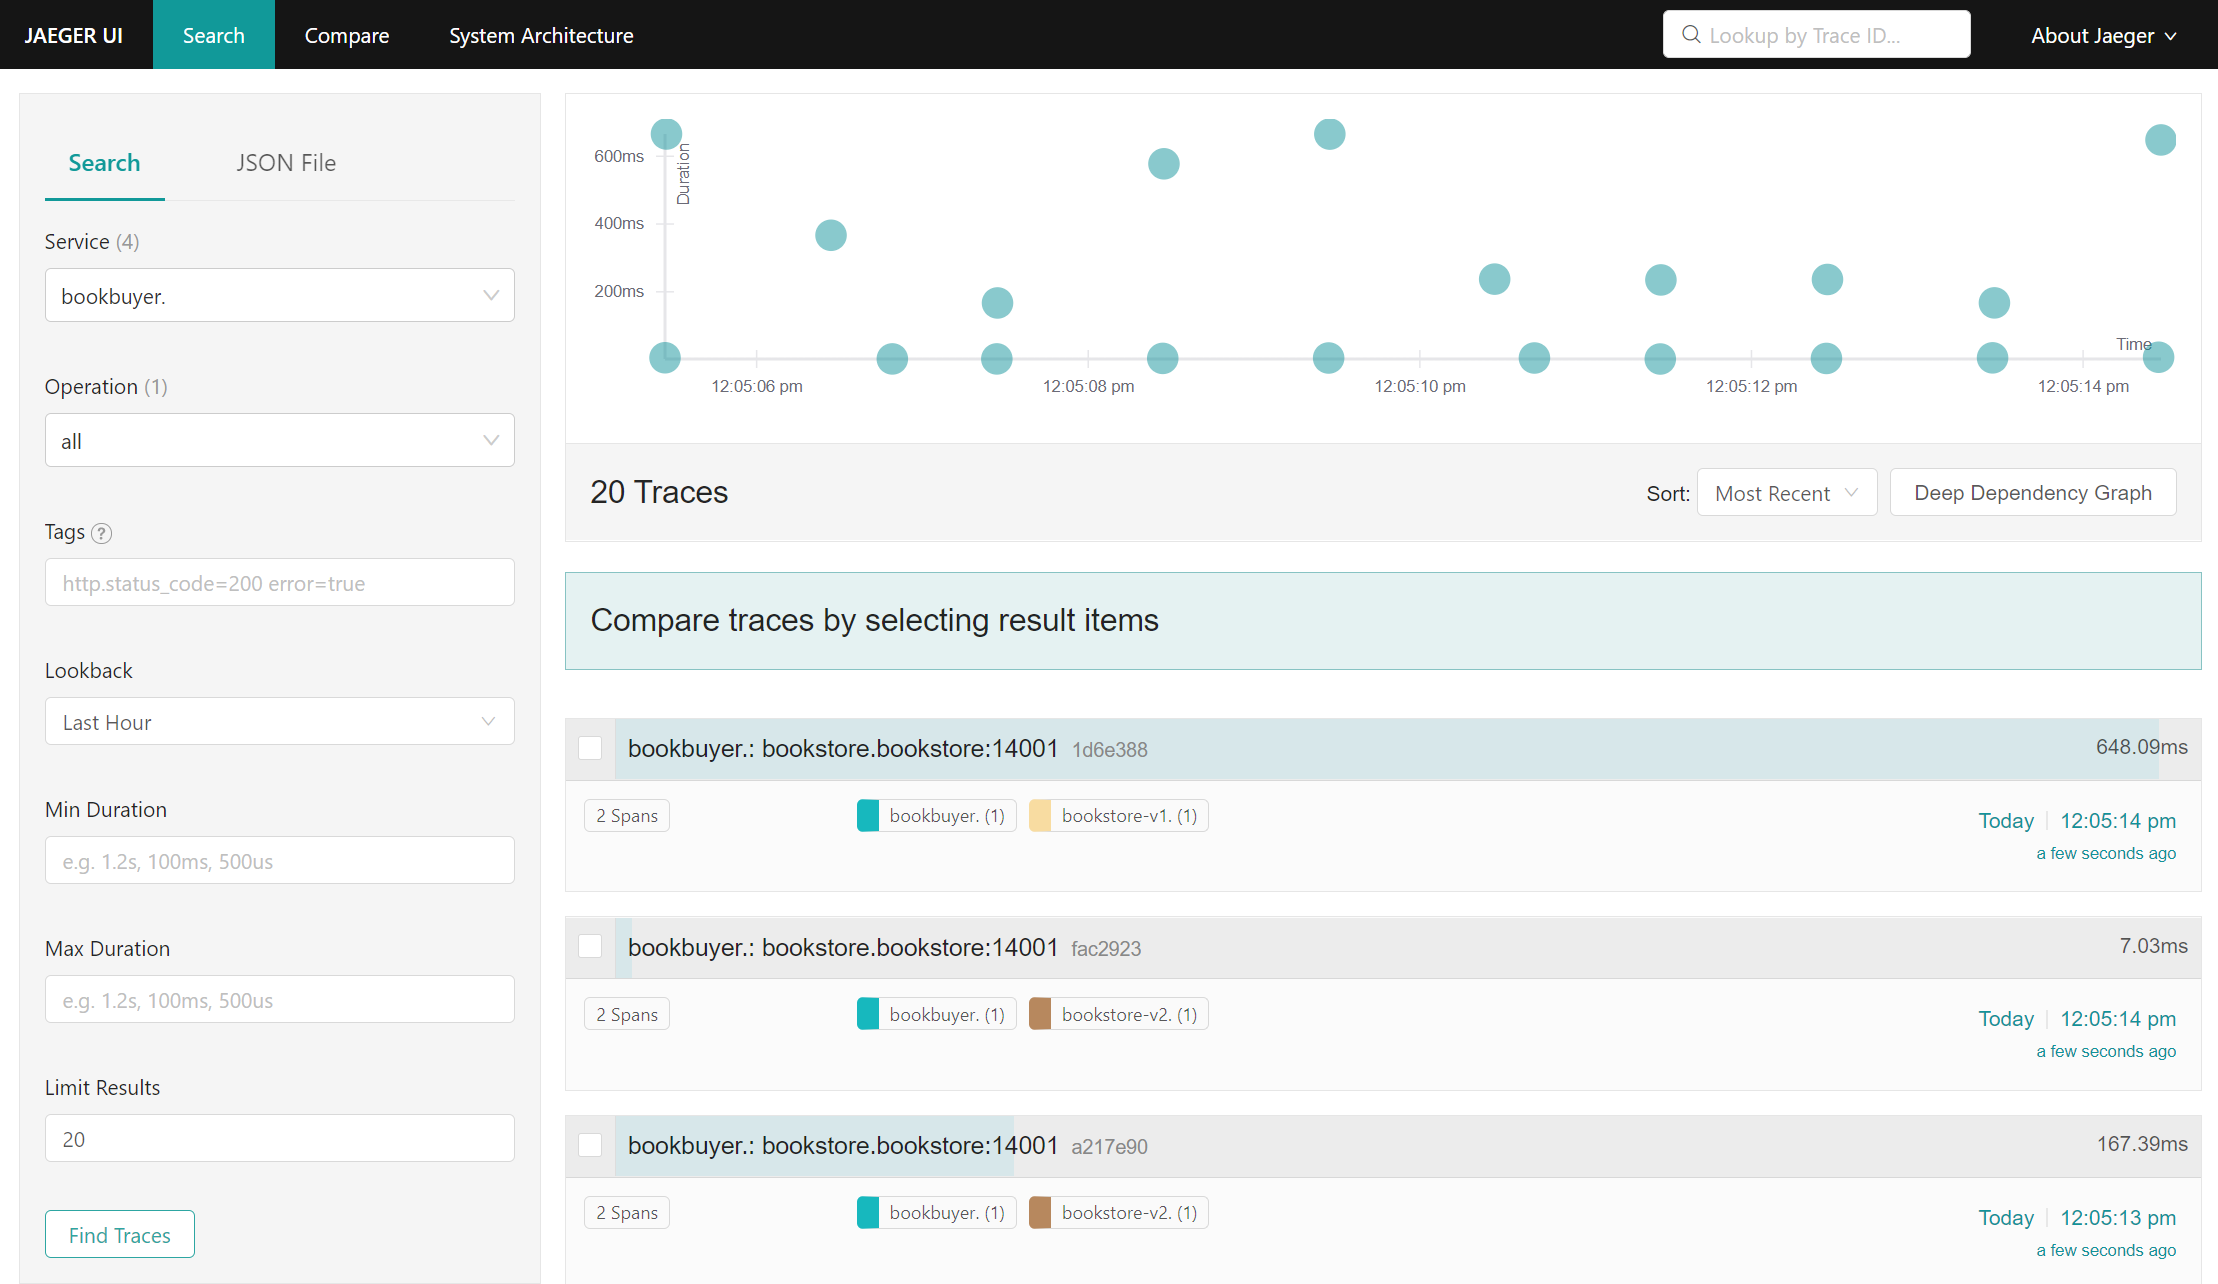
Jaeger UI search for bookbuyer traces b) Click on any item to view it in further detail
c) Select multiple items to compare traces. For example, you can compare the
bookbuyer’s interactions withbookstore-v1andbookstore-v2at a particular moment in time: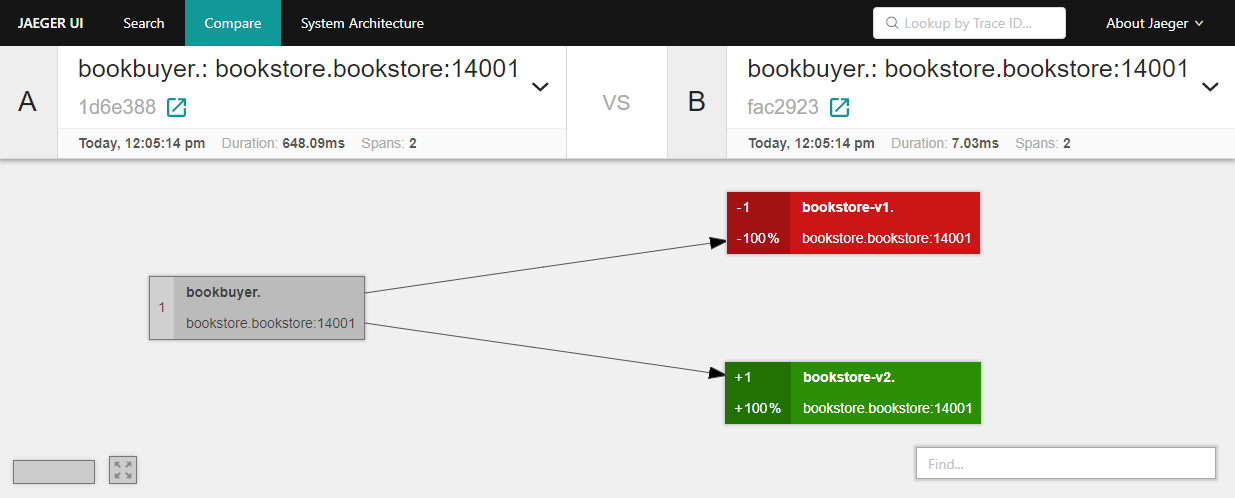
bookbuyer interactions with bookstore-v1 and bookestore-v2 d) Click on the
System Architecturetab to view a graph of how the various applications have been interacting/communicating. This provides an idea of how traffic is flowing between the applications.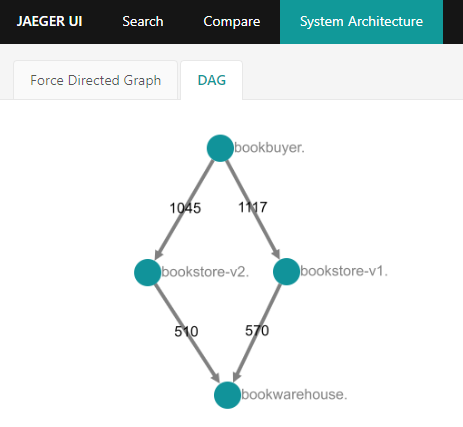
Directed acyclic graph of bookstore demo application interactions
If you are not seeing the bookstore demo applications in the Jaeger UI, tail the bookbuyer logs to ensure that the applications are successfully interacting.
POD="$(kubectl get pods -n "$BOOKBUYER_NAMESPACE" --show-labels --selector app=bookbuyer --no-headers | grep -v 'Terminating' | awk '{print $1}' | head -n1)"
kubectl logs "${POD}" -n "$BOOKBUYER_NAMESPACE" -c bookbuyer --tail=100 -f
Expect to see:
"MAESTRO! THIS TEST SUCCEEDED!"
This suggests that the issue is not caused by your Jaeger or tracing configuration.
Integrate Jaeger Tracing In Your Application
Jaeger tracing does not come effort-free. In order for Jaeger to connect requests to traces automatically, it is the application’s responsibility to publish the tracing information correctly.
In Open Service Mesh’s sidecar proxy configuration, currently Zipkin is used as the HTTP tracer. Therefore an application can leverage Zipkin supported headers to provide tracing information. In the initial request of a trace, the Zipkin plugin will generate the required HTTP headers. An application should propagate the headers below if it needs to add subsequent requests to the current trace:
x-request-idx-b3-traceidx-b3-spanidx-b3-parentspanid
Troubleshoot Tracing/Jaeger
When tracing is not working as expected.
1. Verify that tracing is enabled
Ensure the enable key in the tracing configuration is set to true:
kubectl get meshconfig fsm-mesh-config -n fsm-system -o jsonpath='{.spec.observability.tracing.enable}{"\n"}'
true
2. Verify the tracing values being set are as expected
If tracing is enabled, you can verify the specific address, port and endpoint being used for tracing in the fsm-mesh-config resource:
kubectl get meshconfig fsm-mesh-config -n fsm-system -o jsonpath='{.spec.observability.tracing}{"\n"}'
To verify that the Pipy point to the FQDN you intend to use, check the value for the address key.
3. Verify the tracing values being used are as expected
To dig one level deeper, you may also check whether the values set by the MeshConfig are being correctly used. Use the command below to get the config dump of the pod in question and save the output in a file.
fsm proxy get config_dump -n <pod-namespace> <pod-name> > <file-name>
Open the file in your favorite text editor and search for pipy-tracing-cluster. You should be able to see the tracing values in use. Example output for the bookbuyer pod:
"name": "pipy-tracing-cluster",
"type": "LOGICAL_DNS",
"connect_timeout": "1s",
"alt_stat_name": "pipy-tracing-cluster",
"load_assignment": {
"cluster_name": "pipy-tracing-cluster",
"endpoints": [
{
"lb_endpoints": [
{
"endpoint": {
"address": {
"socket_address": {
"address": "jaeger.fsm-system.svc.cluster.local",
"port_value": 9411
[...]
4. Verify that the FSM Controller was installed with Jaeger automatically deployed [optional]
If you used automatic bring-up, you can additionally check for the Jaeger service and Jaeger deployment:
# Assuming FSM is installed in the fsm-system namespace:
kubectl get services -n fsm-system -l app=jaeger
NAME TYPE CLUSTER-IP EXTERNAL-IP PORT(S) AGE
jaeger ClusterIP 10.99.2.87 <none> 9411/TCP 27m
# Assuming FSM is installed in the fsm-system namespace:
kubectl get deployments -n fsm-system -l app=jaeger
NAME READY UP-TO-DATE AVAILABLE AGE
jaeger 1/1 1 1 27m
5. Verify Jaeger pod readiness, responsiveness and health
Check if the Jaeger pod is running in the namespace you have deployed it in:
The commands below are specific to FSM’s automatic deployment of Jaeger; substitute namespace and label values for your own tracing instance as applicable:
kubectl get pods -n fsm-system -l app=jaeger
NAME READY STATUS RESTARTS AGE
jaeger-8ddcc47d9-q7tgg 1/1 Running 5 27m
To get information about the Jaeger instance, use kubectl describe pod and check the Events in the output.
kubectl describe pod -n fsm-system -l app=jaeger
External Resources
4.3 - Logs
FSM control plane components log diagnostic messages to stdout to aid in managing a mesh.
In the logs, users can expect to see the following kinds of information alongside messages:
- Kubernetes resource metadata, like names and namespaces
- mTLS certificate common names
FSM will not log sensitive information, such as:
- Kubernetes Secret data
- entire Kubernetes resources
Verbosity
Log verbosity controls when certain log messages are written, for example to include more messages for debugging or to include fewer messages that only point to critical errors.
FSM defines the following log levels in order of increasing verbosity:
| Log level | Purpose |
|---|---|
| disabled | Disables logging entirely |
| panic | Currently unused |
| fatal | For unrecoverable errors resulting in termination, usually on startup |
| error | For errors that may require user action to resolve |
| warn | For recovered errors or unexpected conditions that may lead to errors |
| info | For messages indicating normal behavior, such as acknowledging some user action |
| debug | For extra information useful in figuring out why a mesh may not be working as expected |
| trace | For extra verbose messages, used primarily for development |
Each of the above log levels can be configured in the MeshConfig at
spec.observability.fsmLogLevel or on install with the
fsm.controllerLogLevel chart value.
Fluent Bit
When enabled, Fluent Bit can collect these logs, process them and send them to an output of the user’s choice such as Elasticsearch, Azure Log Analytics, BigQuery, etc.
Fluent Bit is an open source log processor and forwarder which allows you to collect data/logs and send them to multiple destinations. It can be used with FSM to forward FSM controller logs to a variety of outputs/log consumers by using its output plugins.
FSM provides log forwarding by optionally deploying a Fluent Bit sidecar to the FSM controller using the --set=fsm.enableFluentbit=true flag during installation. The user can then define where FSM logs should be forwarded using any of the available Fluent Bit output plugins.
Configuring Log Forwarding with Fluent Bit
By default, the Fluent Bit sidecar is configured to simply send logs to the Fluent Bit container’s stdout. If you have installed FSM with Fluent Bit enabled, you may access these logs using kubectl logs -n <fsm-namespace> <fsm-controller-name> -c fluentbit-logger. This command will also help you find how your logs are formatted in case you need to change your parsers and filters.
Note:
<fsm-namespace>refers to the namespace where the fsm control plane is installed.
To quickly bring up Fluent Bit with default values, use the --set=fsm.enableFluentbit option:
fsm install --set=fsm.enableFluentbit=true
By default, logs will be filtered to emit info level logs. You may change the log level to “debug”, “warn”, “fatal”, “panic”, “disabled” or “trace” during installation using --set fsm.controllerLogLevel=<desired log level> . To get all logs, set the log level to trace.
Once you have tried out this basic setup, we recommend configuring log forwarding to your preferred output for more informative results.
To customize log forwarding to your output, follow these steps and then reinstall FSM with Fluent Bit enabled.
Find the output plugin you would like to forward your logs to in Fluent Bit documentation. Replace the
[OUTPUT]section influentbit-configmap.yamlwith appropriate values.The default configuration uses CRI log format parsing. If you are using a kubernetes distribution that causes your logs to be formatted differently, you may need to add a new parser to the
[PARSER]section and change theparsername in the[INPUT]section to one of the parsers defined here.Explore available Fluent Bit Filters and add as many
[FILTER]sections as desired.- The
[INPUT]section tags ingested logs withkube.*so make sure to includeMatch kube.*key/value pair in each of your custom filters. - The default configuration uses a modify filter to add a
controller_pod_namekey/value pair to help you query logs in your output by refining results on pod name (see example usage below).
- The
For these changes to take effect, run:
make build-fsmOnce you have updated the Fluent Bit ConfigMap template, you can deploy Fluent Bit during FSM installation using:
fsm install --set=fsm.enableFluentbit=true [--set fsm.controllerLogLevel=<desired log level>]You should now be able to interact with error logs in the output of your choice as they get generated.
Example: Using Fluent Bit to send logs to Azure Monitor
Fluent Bit has an Azure output plugin that can be used to send logs to an Azure Log Analytics workspace as follows:
Navigate to your new workspace in Azure Portal. Find your Workspace ID and Primary key in your workspace under Agents management. In
values.yaml, underfluentBit, update theoutputPlugintoazureand keysworkspaceIdandprimaryKeywith the corresponding values from Azure Portal (without quotes). Alternatively, you may replace entire output section influentbit-configmap.yamlas you would for any other output plugin.Run through steps 2-5 above.
Once you run FSM with Fluent Bit enabled, logs will populate under the Logs > Custom Logs section in your Log Analytics workspace. There, you may run the following query to view most recent logs first:
fluentbit_CL | order by TimeGenerated descRefine your log results on a specific deployment of the FSM controller pod:
| where controller_pod_name_s == "<desired fsm controller pod name>"
Once logs have been sent to Log Analytics, they can also be consumed by Application Insights as follows:
Navigate to your instance in Azure Portal. Go to the Logs section. Run this query to ensure that logs are being picked up from Log Analytics:
workspace("<your-log-analytics-workspace-name>").fluentbit_CL
You can now interact with your logs in either of these instances.
Note: Fluent Bit is not currently supported on OpenShift.
Configuring Outbound Proxy Support for Fluent Bit
You may require outbound proxy support if your egress traffic is configured to go through a proxy server. There are two ways to enable this.
If you have already built FSM with the MeshConfig changes above, you can simply enable proxy support using the FSM CLI, replacing your values in the command below:
fsm install --set=fsm.enableFluentbit=true,fsm.fluentBit.enableProxySupport=true,fsm.fluentBit.httpProxy=<http-proxy-host:port>,fsm.fluentBit.httpsProxy=<https-proxy-host:port>
Alternatively, you may change the values in the Helm chart by updating the following in values.yaml:
Change
enableProxySupporttotrueUpdate the httpProxy and httpsProxy values to
"http://<host>:<port>". If your proxy server requires basic authentication, you may include its username and password as:http://<username>:<password>@<host>:<port>For these changes to take effect, run:
make build-fsmInstall FSM with Fluent Bit enabled:
fsm install --set=fsm.enableFluentbit=true
NOTE: Ensure that the Fluent Bit image tag is
1.6.4or greater as it is required for this feature.
5 - Health Checks
5.1 - Configure Health Probes
Overview
Implementing health probes in your application is a great way for Kubernetes to automate some tasks to improve availability in the event of an error.
Because FSM reconfigures application Pods to redirect all incoming and outgoing network traffic through the proxy sidecar, httpGet and tcpSocket health probes invoked by the kubelet will fail due to the lack of any mTLS context required by the proxy.
For httpGet health probes to continue to work as expected from within the mesh, FSM adds configuration to expose the probe endpoint via the proxy and rewrites the probe definitions for new Pods to refer to the proxy-exposed endpoint. All of the functionality of the original probe is still used, FSM simply fronts it with the proxy so the kubelet can communicate with it.
Special configuration is required to support tcpSocket health probes in the mesh. Since FSM redirects all network traffic through Pipy, all ports appear open in the Pod. This causes all TCP connections routed to Pod’s injected with an Pipy sidecar to appear successful. For tcpSocket health probes to work as expected in the mesh, FSM rewrites the probes to be httpGet probes and adds an iptables command to bypass the Pipy proxy at the fsm-healthcheck exposed endpoint. The fsm-healthcheck container is added to the Pod and handles the HTTP health probe requests from kubelet. The handler gets the original TCP port from the request’s Original-Tcp-port header and attempts to open a socket on the specified port. The response status code for the httpGet probe will reflect if the TCP connection was successful.
| Probe | Path | Port |
|---|---|---|
| Liveness | /fsm-liveness-probe | 15901 |
| Readiness | /fsm-readiness-probe | 15902 |
| Startup | /fsm-startup-probe | 15903 |
| Healthcheck | /fsm-healthcheck | 15904 |
For HTTP and tcpSocket probes, the port and path are modified. For HTTPS probes, the port is modified, but the path is left unchanged.
Only predefined httpGet and tcpSocket probes are modified. If a probe is undefined, one will not be added in its place. exec probes (including those using grpc_health_probe) are never modified and will continue to function as expected as long as the command does not require network access outside of localhost.
Examples
The following examples show how FSM handles health probes for Pods in a mesh.
HTTP
Consider a Pod spec defining a container with the following livenessProbe:
livenessProbe:
httpGet:
path: /liveness
port: 14001
scheme: HTTP
When the Pod is created, FSM will modify the probe to be the following:
livenessProbe:
httpGet:
path: /fsm-liveness-probe
port: 15901
scheme: HTTP
The Pod’s proxy will contain the following Pipy configuration.
An Pipy cluster which maps to the original probe port 14001:
{
"Probes": {
"ReadinessProbes": null,
"LivenessProbes": [
{
"httpGet": {
"path": "/fsm-liveness-probe",
"port": 15901,
"scheme": "HTTP"
},
"timeoutSeconds": 1,
"periodSeconds": 10,
"successThreshold": 1,
"failureThreshold": 3
}
],
"StartupProbes": null
}
}
}
A listener for the new proxy-exposed HTTP endpoint at /fsm-liveness-probe on port 15901 mapping to the cluster above:
.listen(probeScheme ? 15901 : 0)
.link(
'http_liveness', () => probeScheme === 'HTTP',
'connection_liveness', () => Boolean(probeTarget),
'deny_liveness'
)
tcpSocket
Consider a Pod spec defining a container with the following livenessProbe:
livenessProbe:
tcpSocket:
port: 14001
When the Pod is created, FSM will modify the probe to be the following:
livenessProbe:
httpGet:
httpHeaders:
- name: Original-Tcp-Port
value: "14001"
path: /fsm-healthcheck
port: 15904
scheme: HTTP
Requests to port 15904 bypass the Pipy proxy and are directed to the fsm-healthcheck endpoint.
How to Verify Health of Pods in the Mesh
Kubernetes will automatically poll the health endpoints of Pods configured with startup, liveness, and readiness probes.
When a startup probe fails, Kubernetes will generate an Event (visible by kubectl describe pod <pod name>) and restart the Pod. The kubectl describe output may look like this:
...
Events:
Type Reason Age From Message
---- ------ ---- ---- -------
Normal Scheduled 17s default-scheduler Successfully assigned bookstore/bookstore-v1-699c79b9dc-5g8zn to fsm-control-plane
Normal Pulled 16s kubelet Successfully pulled image "flomesh/init:latest-main" in 26.5835ms
Normal Created 16s kubelet Created container fsm-init
Normal Started 16s kubelet Started container fsm-init
Normal Pulling 16s kubelet Pulling image "flomesh/init:latest-main"
Normal Pulling 15s kubelet Pulling image "flomesh/pipy:0.5.0"
Normal Pulling 15s kubelet Pulling image "flomesh/bookstore:latest-main"
Normal Pulled 15s kubelet Successfully pulled image "flomesh/bookstore:latest-main" in 319.9863ms
Normal Started 15s kubelet Started container bookstore-v1
Normal Created 15s kubelet Created container bookstore-v1
Normal Pulled 14s kubelet Successfully pulled image "flomesh/pipy:0.5.0" in 755.2666ms
Normal Created 14s kubelet Created container pipy
Normal Started 14s kubelet Started container pipy
Warning Unhealthy 13s kubelet Startup probe failed: Get "http://10.244.0.23:15903/fsm-startup-probe": dial tcp 10.244.0.23:15903: connect: connection refused
Warning Unhealthy 3s (x2 over 8s) kubelet Startup probe failed: HTTP probe failed with statuscode: 503
When a liveness probe fails, Kubernetes will generate an Event (visible by kubectl describe pod <pod name>) and restart the Pod. The kubectl describe output may look like this:
...
Events:
Type Reason Age From Message
---- ------ ---- ---- -------
Normal Scheduled 59s default-scheduler Successfully assigned bookstore/bookstore-v1-746977967c-jqjt4 to fsm-control-plane
Normal Pulling 58s kubelet Pulling image "flomesh/init:latest-main"
Normal Created 58s kubelet Created container fsm-init
Normal Started 58s kubelet Started container fsm-init
Normal Pulled 58s kubelet Successfully pulled image "flomesh/init:latest-main" in 23.415ms
Normal Pulled 57s kubelet Successfully pulled image "flomesh/pipy:0.5.0" in 678.1391ms
Normal Pulled 57s kubelet Successfully pulled image "flomesh/bookstore:latest-main" in 230.3681ms
Normal Created 57s kubelet Created container pipy
Normal Pulling 57s kubelet Pulling image "flomesh/pipy:0.5.0"
Normal Started 56s kubelet Started container pipy
Normal Pulled 44s kubelet Successfully pulled image "flomesh/bookstore:latest-main" in 20.6731ms
Normal Created 44s (x2 over 57s) kubelet Created container bookstore-v1
Normal Started 43s (x2 over 57s) kubelet Started container bookstore-v1
Normal Pulling 32s (x3 over 58s) kubelet Pulling image "flomesh/bookstore:latest-main"
Warning Unhealthy 32s (x6 over 50s) kubelet Liveness probe failed: HTTP probe failed with statuscode: 503
Normal Killing 32s (x2 over 44s) kubelet Container bookstore-v1 failed liveness probe, will be restarted
When a readiness probe fails, Kubernetes will generate an Event (visible with kubectl describe pod <pod name>) and ensure no traffic destined for Services the Pod may be backing is routed to the unhealthy Pod. The kubectl describe output for a Pod with a failing readiness probe may look like this:
...
Events:
Type Reason Age From Message
---- ------ ---- ---- -------
Normal Scheduled 32s default-scheduler Successfully assigned bookstore/bookstore-v1-5848999cb6-hp6qg to fsm-control-plane
Normal Pulling 31s kubelet Pulling image "flomesh/init:latest-main"
Normal Pulled 31s kubelet Successfully pulled image "flomesh/init:latest-main" in 19.8726ms
Normal Created 31s kubelet Created container fsm-init
Normal Started 31s kubelet Started container fsm-init
Normal Created 30s kubelet Created container bookstore-v1
Normal Pulled 30s kubelet Successfully pulled image "flomesh/bookstore:latest-main" in 314.3628ms
Normal Pulling 30s kubelet Pulling image "flomesh/bookstore:latest-main"
Normal Started 30s kubelet Started container bookstore-v1
Normal Pulling 30s kubelet Pulling image "flomesh/pipy:0.5.0"
Normal Pulled 29s kubelet Successfully pulled image "flomesh/pipy:0.5.0" in 739.3931ms
Normal Created 29s kubelet Created container pipy
Normal Started 29s kubelet Started container pipy
Warning Unhealthy 0s (x3 over 20s) kubelet Readiness probe failed: HTTP probe failed with statuscode: 503
The Pod’s status will also indicate that it is not ready which is shown in its kubectl get pod output. For example:
NAME READY STATUS RESTARTS AGE
bookstore-v1-5848999cb6-hp6qg 1/2 Running 0 85s
The Pods’ health probes may also be invoked manually by forwarding the Pod’s necessary port and using curl or any other HTTP client to issue requests. For example, to verify the liveness probe for the bookstore-v1 demo Pod, forward port 15901:
kubectl port-forward -n bookstore deployment/bookstore-v1 15901
Then, in a separate terminal instance, curl may be used to check the endpoint. The following example shows a healthy bookstore-v1:
curl -i localhost:15901/fsm-liveness-probe
HTTP/1.1 200 OK
date: Wed, 31 Mar 2021 16:00:01 GMT
content-length: 1396
content-type: text/html; charset=utf-8
x-pipy-upstream-service-time: 1
server: pipy
<!doctype html>
<html itemscope="" itemtype="http://schema.org/WebPage" lang="en">
...
</html>
Known issues
Troubleshooting
If any health probes are consistently failing, perform the following steps to identify the root cause:
Verify
httpGetandtcpSocketprobes on Pods in the mesh have been modified.Startup, liveness, and readiness
httpGetprobes must be modified by FSM in order to continue to function while in a mesh. Ports must be modified to 15901, 15902, and 15903 for liveness, readiness, and startuphttpGetprobes, respectively. Only HTTP (not HTTPS) probes will have paths modified in addition to be/fsm-liveness-probe,/fsm-readiness-probe, or/fsm-startup-probe.Also, verify the Pod’s Pipy configuration contains a listener for the modified endpoint.
For
tcpSocketprobes to function in the mesh, they must be rewritten tohttpGetprobes. The ports must be modified to 15904 for liveness, readiness, and startup probes. The path the must be set to/fsm-healthcheck. A HTTP header,Original-Tcp-Port, must be set to the original port specified in thetcpSocketprobe definition. Also, verify that thefsm-healthcheckcontainer is running. Inspect thefsm-healthchecklogs for more information.See the examples above for more details.
Determine if Kubernetes encountered any other errors while scheduling or starting the Pod.
Look for any errors that may have recently occurred with
kubectl describeof the unhealthy Pod. Resolve any errors and verify the Pod’s health again.Determine if the Pod encountered a runtime error.
Look for any errors that may have occurred after the container started by inspecting its logs with
kubectl logs. Resolve any errors and verify the Pod’s health again.
5.2 - FSM Control Plane Health Probes
FSM control plane components leverage health probes to communicate their overall status. Health probes are implemented as HTTP endpoints which respond to requests with HTTP status codes indicating success or failure.
Kubernetes uses these probes to communicate the status of the control plane Pods’ statuses and perform some actions automatically to improve availability. More details about Kubernetes probes can be found here.
FSM Components with Probes
The following FSM control plane components have health probes:
fsm-controller
The following HTTP endpoints are available on fsm-controller on port 9091:
/health/alive: HTTP 200 response code indicates FSM’s Aggregated Discovery Service (ADS) is running. No response is sent when the service is not yet running./health/ready: HTTP 200 response code indicates ADS is ready to accept gRPC connections from proxies. HTTP 503 or no response indicates gRPC connections from proxies will not be successful.
fsm-injector
The following HTTP endpoints are available on fsm-injector on port 9090:
/healthz: HTTP 200 response code indicates the injector is ready to inject new Pods with proxy sidecar containers. No response is sent otherwise.
How to Verify FSM Health
Because FSM’s Kubernetes resources are configured with liveness and readiness probes, Kubernetes will automatically poll the health endpoints on the fsm-controller and fsm-injector Pods.
When a liveness probe fails, Kubernetes will generate an Event (visible by kubectl describe pod <pod name>) and restart the Pod. The kubectl describe output may look like this:
...
Events:
Type Reason Age From Message
---- ------ ---- ---- -------
Normal Scheduled 24s default-scheduler Successfully assigned fsm-system/fsm-controller-85fcb445b-fpv8l to fsm-control-plane
Normal Pulling 23s kubelet Pulling image "flomesh/fsm-controller:v0.8.0"
Normal Pulled 23s kubelet Successfully pulled image "flomesh/fsm-controller:v0.8.0" in 562.2444ms
Normal Created 1s (x2 over 23s) kubelet Created container fsm-controller
Normal Started 1s (x2 over 23s) kubelet Started container fsm-controller
Warning Unhealthy 1s (x3 over 21s) kubelet Liveness probe failed: HTTP probe failed with statuscode: 503
Normal Killing 1s kubelet Container fsm-controller failed liveness probe, will be restarted
When a readiness probe fails, Kubernetes will generate an Event (visible with kubectl describe pod <pod name>) and ensure no traffic destined for Services the Pod may be backing is routed to the unhealthy Pod. The kubectl describe output for a Pod with a failing readiness probe may look like this:
...
Events:
Type Reason Age From Message
---- ------ ---- ---- -------
Normal Scheduled 36s default-scheduler Successfully assigned fsm-system/fsm-controller-5494bcffb6-tn5jv to fsm-control-plane
Normal Pulling 36s kubelet Pulling image "flomesh/fsm-controller:latest"
Normal Pulled 35s kubelet Successfully pulled image "flomesh/fsm-controller:v0.8.0" in 746.4323ms
Normal Created 35s kubelet Created container fsm-controller
Normal Started 35s kubelet Started container fsm-controller
Warning Unhealthy 4s (x3 over 24s) kubelet Readiness probe failed: HTTP probe failed with statuscode: 503
The Pod’s status will also indicate that it is not ready which is shown in its kubectl get pod output. For example:
NAME READY STATUS RESTARTS AGE
fsm-controller-5494bcffb6-tn5jv 0/1 Running 0 26s
The Pods’ health probes may also be invoked manually by forwarding the Pod’s necessary port and using curl or any other HTTP client to issue requests. For example, to verify the liveness probe for fsm-controller, get the Pod’s name and forward port 9091:
# Assuming FSM is installed in the fsm-system namespace
kubectl port-forward -n fsm-system $(kubectl get pods -n fsm-system -l app=fsm-controller -o jsonpath='{.items[0].metadata.name}') 9091
Then, in a separate terminal instance, curl may be used to check the endpoint. The following example shows a healthy fsm-controller:
curl -i localhost:9091/health/alive
HTTP/1.1 200 OK
Date: Thu, 18 Mar 2021 20:15:29 GMT
Content-Length: 16
Content-Type: text/plain; charset=utf-8
Service is alive
Troubleshooting
If any health probes are consistently failing, perform the following steps to identify the root cause:
Ensure the unhealthy fsm-controller or fsm-injector Pod is not running an Pipy sidecar container.
To verify The fsm-controller Pod is not running an Pipy sidecar container, verify none of the Pod’s containers’ images is an Pipy image. Pipy images have “flomesh/pipy” in their name.
For example, an fsm-controller Pod that includes an Pipy container:
$ # Assuming FSM is installed in the fsm-system namespace: $ kubectl get pod -n fsm-system $(kubectl get pods -n fsm-system -l app=fsm-controller -o jsonpath='{.items[0].metadata.name}') -o jsonpath='{range .spec.containers[*]}{.image}{"\n"}{end}' flomesh/fsm-controller:v0.8.0 flomesh/pipy:1.1.0-1To verify The fsm-injector Pod is not running an Pipy sidecar container, verify none of the Pod’s containers’ images is an Pipy image. Pipy images have “flomesh/pipy” in their name.
For example, an fsm-injector Pod that includes an Pipy container:
$ # Assuming FSM is installed in the fsm-system namespace: $ kubectl get pod -n fsm-system $(kubectl get pods -n fsm-system -l app=fsm-injector -o jsonpath='{.items[0].metadata.name}') -o jsonpath='{range .spec.containers[*]}{.image}{"\n"}{end}' flomesh/fsm-injector:v0.8.0 flomesh/pipy:1.1.0-1If either Pod is running an Pipy container, it may have been injected erroneously by this or another another instance of FSM. For each mesh found with the
fsm mesh listcommand, verify the FSM namespace of the unhealthy Pod is not listed in thefsm namespace listoutput withSIDECAR-INJECTION“enabled” for any FSM instance found with thefsm mesh listcommand.For example, for all of the following meshes:
$ fsm mesh list MESH NAME NAMESPACE CONTROLLER PODS VERSION SMI SUPPORTED fsm fsm-system fsm-controller-5494bcffb6-qpjdv v0.8.0 HTTPRouteGroup:specs.smi-spec.io/v1alpha4,TCPRoute:specs.smi-spec.io/v1alpha4,TrafficSplit:split.smi-spec.io/v1alpha2,TrafficTarget:access.smi-spec.io/v1alpha3 fsm2 fsm-system-2 fsm-controller-48fd3c810d-sornc v0.8.0 HTTPRouteGroup:specs.smi-spec.io/v1alpha4,TCPRoute:specs.smi-spec.io/v1alpha4,TrafficSplit:split.smi-spec.io/v1alpha2,TrafficTarget:access.smi-spec.io/v1alpha3Note how
fsm-system(the mesh control plane namespace) is present in the following list of namespaces:$ fsm namespace list --mesh-name fsm --fsm-namespace fsm-system NAMESPACE MESH SIDECAR-INJECTION fsm-system fsm2 enabled bookbuyer fsm2 enabled bookstore fsm2 enabledIf the FSM namespace is found in any
fsm namespace listcommand withSIDECAR-INJECTIONenabled, remove the namespace from the mesh injecting the sidecars. For the example above:$ fsm namespace remove fsm-system --mesh-name fsm2 --fsm-namespace fsm-system2Determine if Kubernetes encountered any errors while scheduling or starting the Pod.
Look for any errors that may have recently occurred with
kubectl describeof the unhealthy Pod.For fsm-controller:
$ # Assuming FSM is installed in the fsm-system namespace: $ kubectl describe pod -n fsm-system $(kubectl get pods -n fsm-system -l app=fsm-controller -o jsonpath='{.items[0].metadata.name}')For fsm-injector:
$ # Assuming FSM is installed in the fsm-system namespace: $ kubectl describe pod -n fsm-system $(kubectl get pods -n fsm-system -l app=fsm-injector -o jsonpath='{.items[0].metadata.name}')Resolve any errors and verify FSM’s health again.
Determine if the Pod encountered a runtime error.
Look for any errors that may have occurred after the container started by inspecting its logs. Specifically, look for any logs containing the string
"level":"error".For fsm-controller:
$ # Assuming FSM is installed in the fsm-system namespace: $ kubectl logs -n fsm-system $(kubectl get pods -n fsm-system -l app=fsm-controller -o jsonpath='{.items[0].metadata.name}')For fsm-injector:
$ # Assuming FSM is installed in the fsm-system namespace: $ kubectl logs -n fsm-system $(kubectl get pods -n fsm-system -l app=fsm-injector -o jsonpath='{.items[0].metadata.name}')Resolve any errors and verify FSM’s health again.
6 - Integrations
6.1 - Integrate Dapr with FSM
Dapr FSM Walkthrough
This document walks you through the steps of getting Dapr working with FSM on a Kubernetes cluster.
Install Dapr on your cluster with mTLS disabled:
Dapr has a quickstart repository to help users get familiar with dapr and its features. For this integration demo we will be leveraging the hello-kubernetes quickstart. As we would like to integrate this Dapr example with FSM, there are a few modifications required and they are as follows:
The hello-kubernetes demo installs Dapr with mtls enabled (by default), we would not want mtls from Dapr and would like to leverage FSM for this. Hence while installing Dapr on your cluster, make sure to disable mtls by passing the flag :
--enable-mtls=falseduring the installationFurther hello-kubernetes sets up everything in the default namespace, it is strongly recommended to set up the entire hello-kubernetes demo in a specific namespace (we will later join this namespace to FSM’s mesh). For the purpose of this integration, we have the namespace as
dapr-testkubectl create namespace dapr-test namespace/dapr-test createdThe redis state store, redis.yaml, node.yaml and python.yaml need to be deployed in the
dapr-testnamespaceSince the resources for this demo are set up in a custom namespace. We will need to add an rbac rule on the cluster for Dapr to have access to the secrets. Create the following role and role binding:
kubectl apply -f - <<EOF --- apiVersion: rbac.authorization.k8s.io/v1 kind: Role metadata: name: secret-reader namespace: dapr-test rules: - apiGroups: [""] resources: ["secrets"] verbs: ["get", "list"] --- kind: RoleBinding apiVersion: rbac.authorization.k8s.io/v1 metadata: name: dapr-secret-reader namespace: dapr-test subjects: - kind: ServiceAccount name: default roleRef: kind: Role name: secret-reader apiGroup: rbac.authorization.k8s.io EOF
Ensure the sample applications are running with Dapr as desired.
Install FSM:
fsm install FSM installed successfully in namespace [fsm-system] with mesh name [fsm]Enable permissive mode in FSM:
kubectl patch meshconfig fsm-mesh-config -n fsm-system -p '{"spec":{"traffic":{"enablePermissiveTrafficPolicyMode":true}}}' --type=merge meshconfig.config.flomesh.io/fsm-mesh-config patchedThis is necessary, so that the hello-kubernetes example works as is and no SMI policies are needed from the get go.
Exclude kubernetes API server IP from being intercepted by FSM’s sidecar:
- Get the kubernetes API server cluster IP:
kubectl get svc -n default NAME TYPE CLUSTER-IP EXTERNAL-IP PORT(S) AGE kubernetes ClusterIP 10.0.0.1 <none> 443/TCP 1d - Add this IP to the MeshConfig so that outbound traffic to it is excluded from interception by FSM’s sidecar
kubectl patch meshconfig fsm-mesh-config -n fsm-system -p '{"spec":{"traffic":{"outboundIPRangeExclusionList":["10.0.0.1/32"]}}}' --type=merge meshconfig.config.flomesh.io/fsm-mesh-config patched
It is necessary to exclude the Kubernetes API server IP in FSM because Dapr leverages Kubernetes secrets to access the redis state store in this demo.
Note: If you have hardcoded the password in the Dapr component file, you may skip this step.
- Get the kubernetes API server cluster IP:
Globally exclude ports from being intercepted by FSM’s sidecar:
Get the ports of Dapr’s placement server (
dapr-placement-server):kubectl get svc -n dapr-system NAME TYPE CLUSTER-IP EXTERNAL-IP PORT(S) AGE dapr-api ClusterIP 10.0.172.245 <none> 80/TCP 2h dapr-dashboard ClusterIP 10.0.80.141 <none> 8080/TCP 2h dapr-placement-server ClusterIP None <none> 50005/TCP,8201/TCP 2h dapr-sentry ClusterIP 10.0.87.36 <none> 80/TCP 2h dapr-sidecar-injector ClusterIP 10.0.77.47 <none> 443/TCP 2hGet the ports of your redis state store from the redis.yaml,
6379incase of this demoAdd these ports to the MeshConfig so that outbound traffic to it is excluded from interception by FSM’s sidecar
kubectl patch meshconfig fsm-mesh-config -n fsm-system -p '{"spec":{"traffic":{"outboundPortExclusionList":[50005,8201,6379]}}}' --type=merge meshconfig.config.flomesh.io/fsm-mesh-config patched
It is necessary to globally exclude Dapr’s placement server (
dapr-placement-server) port from being intercepted by FSM’s sidecar, as pods having Dapr on them would need to talk to Dapr’s control plane. The redis state store also needs to be excluded so that Dapr’s sidecar can route the traffic to redis, without being intercepted by FSM’s sidecar.Note: Globally excluding ports would result in all pods in FSM’s mesh from not interceting any outbound traffic to the specified ports. If you wish to exclude the ports selectively only on pods that are running Dapr, you may omit this step and follow the step mentioned below.
Exclude ports from being intercepted by FSM’s sidecar at pod level:
Get the ports of Dapr’s api and sentry (
dapr-sentryanddapr-api):kubectl get svc -n dapr-system NAME TYPE CLUSTER-IP EXTERNAL-IP PORT(S) AGE dapr-api ClusterIP 10.0.172.245 <none> 80/TCP 2h dapr-dashboard ClusterIP 10.0.80.141 <none> 8080/TCP 2h dapr-placement-server ClusterIP None <none> 50005/TCP,8201/TCP 2h dapr-sentry ClusterIP 10.0.87.36 <none> 80/TCP 2h dapr-sidecar-injector ClusterIP 10.0.77.47 <none> 443/TCP 2hUpdate the pod spec in both nodeapp (node.yaml) and pythonapp (python.yaml) to contain the following annotation:
flomesh.io/outbound-port-exclusion-list: "80"
Adding the annotation to the pod excludes Dapr’s api (
dapr-api) and sentry (dapr-sentry) port’s from being intercepted by FSM’s sidecar, as these pods would need to talk to Dapr’s control plane.Make FSM monitor the namespace that was used for the Dapr hello-kubernetes demo setup:
fsm namespace add dapr-test Namespace [dapr-test] successfully added to mesh [fsm]Delete and re-deploy the Dapr hello-kubernetes pods:
kubectl delete -f ./deploy/node.yaml service "nodeapp" deleted deployment.apps "nodeapp" deletedkubectl delete -f ./deploy/python.yaml deployment.apps "pythonapp" deletedkubectl apply -f ./deploy/node.yaml service "nodeapp" created deployment.apps "nodeapp" createdkubectl apply -f ./deploy/python.yaml deployment.apps "pythonapp" createdThe pythonapp and nodeapp pods on restart will now have 3 containers each, indicating FSM’s proxy sidecar has been successfully injected
kubectl get pods -n dapr-test NAME READY STATUS RESTARTS AGE my-release-redis-master-0 1/1 Running 0 2h my-release-redis-slave-0 1/1 Running 0 2h my-release-redis-slave-1 1/1 Running 0 2h nodeapp-7ff6cfb879-9dl2l 3/3 Running 0 68s pythonapp-6bd9897fb7-wdmb5 3/3 Running 0 53sVerify the Dapr hello-kubernetes demo works as expected:
Applying SMI Traffic Policies:
The demo so far illustrated permissive traffic policy mode in FSM whereby application connectivity within the mesh is automatically configured by
fsm-controller, therefore no SMI policy was required for the pythonapp to talk to the nodeapp.In order to see the same demo work with an SMI Traffic Policy, follow the steps outlined below:
Disable permissive mode:
kubectl patch meshconfig fsm-mesh-config -n fsm-system -p '{"spec":{"traffic":{"enablePermissiveTrafficPolicyMode":false}}}' --type=merge meshconfig.config.flomesh.io/fsm-mesh-config patchedVerify the pythonapp documented here no longer causes the order ID to increment.
Create a service account for nodeapp and pythonapp:
kubectl create sa nodeapp -n dapr-test serviceaccount/nodeapp createdkubectl create sa pythonapp -n dapr-test serviceaccount/pythonapp createdUpdate the role binding on the cluster to contain the newly created service accounts:
kubectl apply -f - <<EOF --- kind: RoleBinding apiVersion: rbac.authorization.k8s.io/v1 metadata: name: dapr-secret-reader namespace: dapr-test subjects: - kind: ServiceAccount name: default - kind: ServiceAccount name: nopdeapp - kind: ServiceAccount name: pythonapp roleRef: kind: Role name: secret-reader apiGroup: rbac.authorization.k8s.io EOFApply the following SMI access control policies:
Deploy SMI TrafficTarget
kubectl apply -f - <<EOF --- kind: TrafficTarget apiVersion: access.smi-spec.io/v1alpha3 metadata: name: pythodapp-traffic-target namespace: dapr-test spec: destination: kind: ServiceAccount name: nodeapp namespace: dapr-test rules: - kind: HTTPRouteGroup name: nodeapp-service-routes matches: - new-order sources: - kind: ServiceAccount name: pythonapp namespace: dapr-test EOFDeploy HTTPRouteGroup policy
kubectl apply -f - <<EOF --- apiVersion: specs.smi-spec.io/v1alpha4 kind: HTTPRouteGroup metadata: name: nodeapp-service-routes namespace: dapr-test spec: matches: - name: new-order EOFUpdate the pod spec in both nodeapp (node.yaml) and pythonapp (python.yaml) to contain their respective service accounts. Delete and re-deploy the Dapr hello-kubernetes pods
Verify the Dapr hello-kubernetes demo works as expected, shown here
Cleanup:
To clean up the Dapr hello-kubernetes demo, clean the
dapr-testnamespacekubectl delete ns dapr-testTo uninstall Dapr, run
dapr uninstall --kubernetesTo uninstall FSM, run
fsm uninstall meshTo remove FSM’s cluster wide resources after uninstallation, run the following command. See the uninstall guide for more context and information.
fsm uninstall mesh --delete-cluster-wide-resources
6.2 - Integrate Prometheus with FSM
Prometheus and FSM Integration
To familiarize yourself on how FSM works with Prometheus, try installing a new mesh with sample applications to see which metrics are collected.
Install FSM with its own Prometheus instance:
fsm install --set fsm.deployPrometheus=true,fsm.enablePermissiveTrafficPolicy=trueWait all pods up.
kubectl wait --for=condition=Ready pod --all -n fsm-systemCreate a namespace for sample workloads:
kubectl create namespace metrics-demoMake the new FSM monitor the new namespace:
fsm namespace add metrics-demoConfigure FSM’s Prometheus to scrape metrics from the new namespace:
fsm metrics enable --namespace metrics-demoInstall sample applications:
kubectl apply -f https://raw.githubusercontent.com/flomesh-io/fsm-docs/main/manifests/samples/curl/curl.yaml -n metrics-demo kubectl apply -f https://raw.githubusercontent.com/flomesh-io/fsm-docs/main/manifests/samples/httpbin/httpbin.yaml -n metrics-demoEnsure the new Pods are Running and all containers are ready:
kubectl get pods -n metrics-demo NAME READY STATUS RESTARTS AGE curl-54ccc6954c-q8s89 2/2 Running 0 95s httpbin-8484bfdd46-vq98x 2/2 Running 0 72sGenerate traffic:
The following command makes the curl Pod make about 1 request per second to the httpbin Pod forever:
kubectl exec -n metrics-demo -ti "$(kubectl get pod -n metrics-demo -l app=curl -o jsonpath='{.items[0].metadata.name}')" -c curl -- sh -c 'while :; do curl -i httpbin.metrics-demo:14001/status/200; sleep 1; done' HTTP/1.1 200 OK server: gunicorn/19.9.0 date: Wed, 06 Jul 2022 02:53:16 GMT content-type: text/html; charset=utf-8 access-control-allow-origin: * access-control-allow-credentials: true content-length: 0 connection: keep-alive HTTP/1.1 200 OK server: gunicorn/19.9.0 date: Wed, 06 Jul 2022 02:53:17 GMT content-type: text/html; charset=utf-8 access-control-allow-origin: * access-control-allow-credentials: true content-length: 0 connection: keep-alive ...View metrics in Prometheus:
Forward the Prometheus port:
kubectl port-forward -n fsm-system $(kubectl get pods -n fsm-system -l app=fsm-prometheus -o jsonpath='{.items[0].metadata.name}') 7070 Forwarding from 127.0.0.1:7070 -> 7070 Forwarding from [::1]:7070 -> 7070Navigate to http://localhost:7070 in a web browser to view the Prometheus UI. The following query shows how many requests per second are being made from the curl pod to the httpbin pod, which should be about 1:
irate(sidecar_cluster_upstream_rq_xx{exported_source_workload_name="curl", sidecar_cluster_name="metrics-demo/httpbin|14001"}[30s])Feel free to explore the other metrics available from within the Prometheus UI.
Cleanup
Once you are done with the demo resources, clean them up by first deleting the application namespace:
kubectl delete ns metrics-demoThen, uninstall FSM:
fsm uninstall mesh Uninstall FSM [mesh name: fsm] ? [y/n]: y FSM [mesh name: fsm] uninstalledTo remove FSM’s cluster wide resources after uninstallation, run the following command. See the uninstall guide for more context and information.
fsm uninstall mesh --delete-namespace -a -f
6.3 - Microservice Discovery Integration
FSM, as a service mesh product, operates on the concept of a “unified service directory” to manage and accommodate various microservice architectures. It automatically identifies and integrates deployed services into a centralized service directory. This enables real-time and automated interactions among microservices, whether they are deployed on Kubernetes (K8s) or other environments.
For non-K8s environments, FSM supports multiple popular service registries. This means it can integrate with different service discovery systems, including:
- Consul: A service mesh solution by HashiCorp for service discovery and configuration.
- Eureka: A service discovery tool developed by Netflix, part of the Spring Cloud Netflix microservice suite.
- Nacos: An open-source service discovery and configuration management system by Alibaba, aimed at providing dynamic service discovery and configuration management for cloud-native applications.
Adapting these registries, FSM enhances its application in hybrid architectures, allowing users to enjoy the benefits of a service mesh without being limited to a specific microservice framework. This compatibility positions FSM as a strong service mesh option in diverse microservice environments.
Unified Service Directory
The unified service directory provides a smooth integration experience. By abstracting services from different microservice registries into Kubernetes services (K8s Services), FSM standardizes service information. This approach has several key advantages:
- Simplified service discovery: Services from different sources need not write and maintain multiple sets of code for different discovery mechanisms; everything is uniformly handled through K8s Services.
- Reduced complexity: Encapsulating different service registries as K8s Services means users only need to interact with the K8s API, simplifying operations.
- Seamless cloud-native integration: For services already running on Kubernetes, this unified service model integrates seamlessly, enhancing inter-service operability.
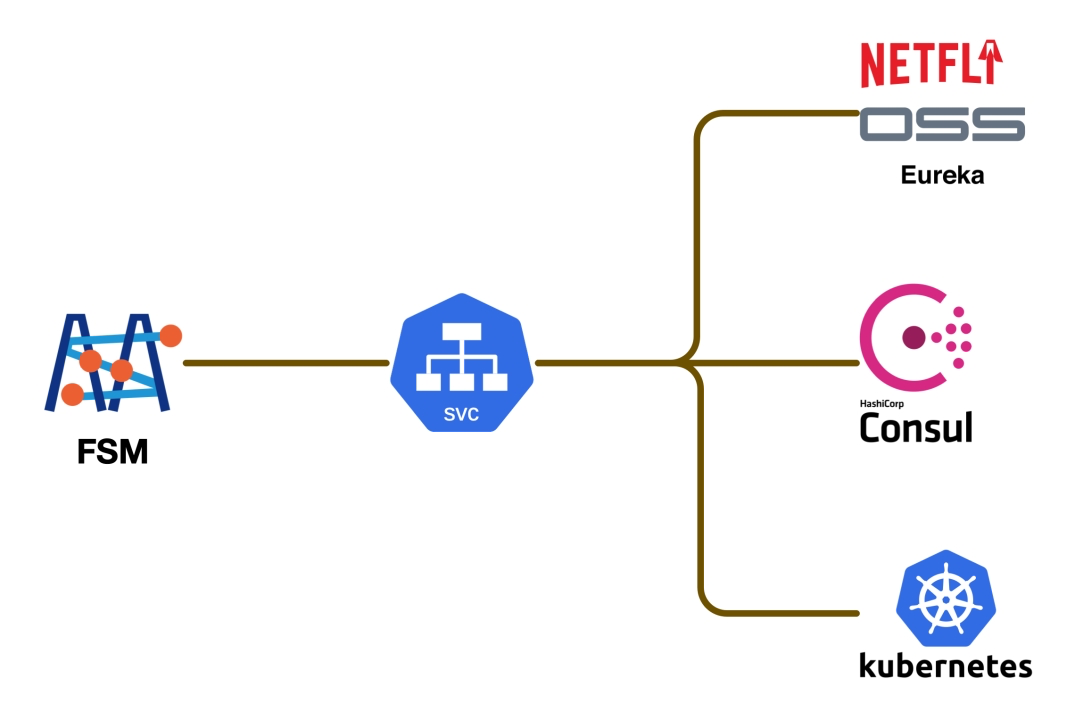
Connectors
FSM uses framework-specific connectors to interface with different microservice registries. Each connector is tasked with communicating with a specific registry (such as Consul, Eureka, or Nacos), performing key tasks like service registration, monitoring service changes, encapsulating as K8s Services, and writing to the cluster.
Connectors are independent components developed in Go (theoretically supporting other languages as well) that can quickly interface with packages provided by the corresponding registry.
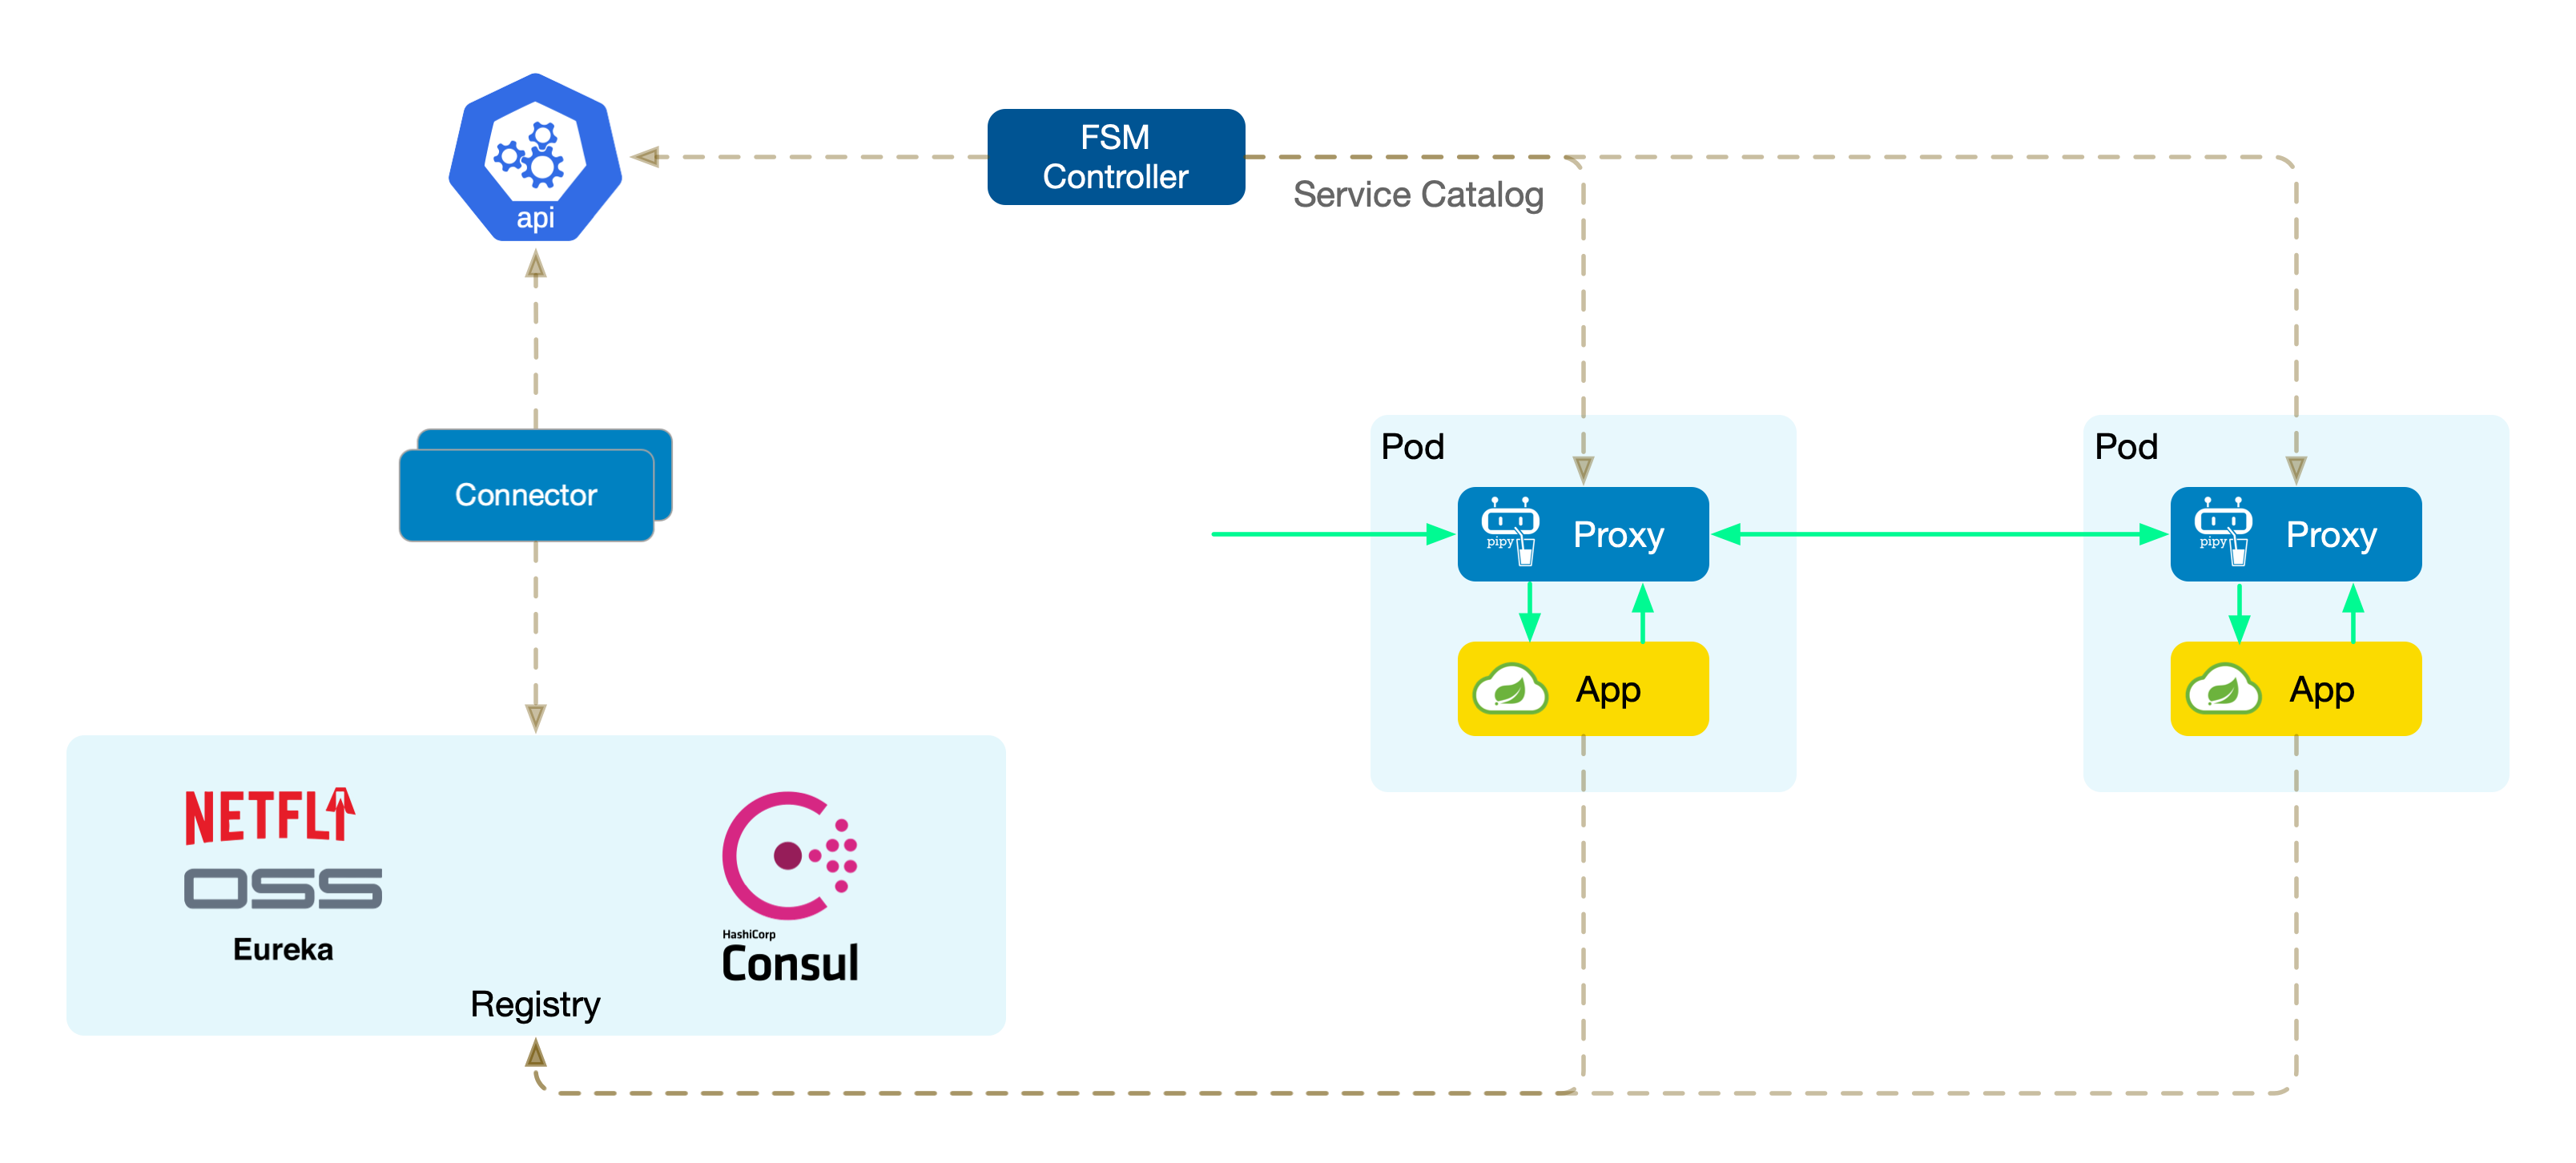
Next, we demonstrate integrating Spring Cloud Consul microservices into the service mesh and testing the commonly used canary release scenario.
7 - Security
7.1 - Bi-directional mTLS
This guide will demonstrate how to configure different TLS certificates for inbound and outbound traffic.
Bi-directional mTLS
There are some use cases, where it is desired to use different TLS certificates for inbound and outbound communication.

Demos
7.2 - Access Control Management
Access Control Management
Deploying a service mesh in a complex brownfield environment is a lengthy and gradual process requiring upfront planning, or there may exist use cases where you have a specific set of services that either aren’t yet ready for migration or for some reason can not be migrated to service mesh.
This guide will talk about the approaches which can be used to enable services outside of the service mesh to communicate with services within the FSM service mesh.
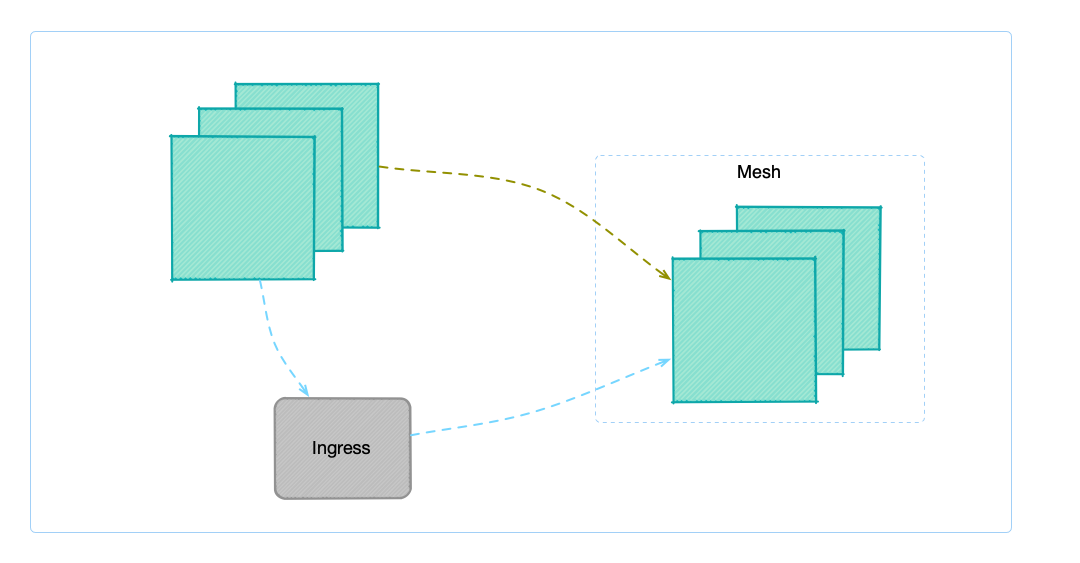
FSM offers two ways to allow accessing services within the service mesh:
- via Ingress
- FSM Ingress controller
- Nginx Ingress controller
- Access Control
- Service
- IPRange
The first method to access the services in the service mesh is via Ingress controller, and treat the services outside the mesh as the services inside the cluster. The advantage of this approach is that the setup is simple and straightforward and the disadvantages are also apparent, as you cannot achieve fine-grained access control, and all services outside the mesh can access services within the mesh.
This guide will focus on the second approach, which allows support for fine-grained access control on who can access services within the service mesh. This feature was added and to release FSM v1.1.0.
Access Control can be configured via two resource types: Service and IP range. In terms of data transmission, it supports plaintext transmission and mTLS-encrypted traffic.
Demo
To learn more about access control, refer to following demo guides:
7.3 - Certificate Management
mTLS and Certificate Issuance
FSM uses mTLS for encryption of data between pods as well as Pipy and service identity. Certificates are created and distributed to each Pipy proxy by the FSM control plane.
Types of Certificates
There are a few kinds of certificates used in FSM:
| Certificate Type | How it is used | Validity duration | Sample CommonName |
|---|---|---|---|
| service | used for east-west communication between Pipy; identifies Service Accounts | default 24h; defined by fsm.certificateProvider.serviceCertValidityDuration install option | bookstore-v2.bookstore.cluster.local |
| webhook server | used by the mutating, validating and CRD conversion webhook servers | a decade | fsm-injector.fsm-system.svc |
Root Certificate
The root certificate for the service mesh is stored in an Opaque Kubernetes Secret named fsm-ca-bundle in the namespace where fsm is installed (by default fsm-system).
The secret YAML has the following shape:
apiVersion: v1
kind: Secret
type: Opaque
metadata:
name: fsm-ca-bundle
namespace: fsm-system
data:
ca.crt: <base64 encoded root cert>
private.key: <base64 encoded private key>
To read the root certificate (with the exception of Hashicorp Vault), you can retrieve the corresponding secret and decode it:
kubectl get secret -n $fsm_namespace $fsm_ca_bundle -o jsonpath='{.data.ca\.crt}' |
base64 -d |
openssl x509 -text -noout
Note: By default, the CA bundle is named fsm-ca-bundle.
This will provide valuable certificate information, such as the expiration date and the issuer.
Root Certificate Rotation
Tresor
WARNING: Rotating root certificates will incur downtime between any services as they transition their mTLS certs from one issuer to the next.
We are currently working on a zero-downtime root cert rotation mechanism that we expect to announce in one of our upcoming releases.
The self-signed root certificate, which is created via the Tresor package within FSM, will expire in a decade. To rotate the root cert, the following steps should be followed:
Delete the
fsm-ca-bundlecertificate in the fsm namespaceexport fsm_namespace=fsm-system # Replace fsm-system with the namespace where FSM is installed kubectl delete secret fsm-ca-bundle -n $fsm_namespaceRestart the control plane components
kubectl rollout restart deploy fsm-controller -n $fsm_namespace kubectl rollout restart deploy fsm-injector -n $fsm_namespace kubectl rollout restart deploy fsm-bootstrap -n $fsm_namespace
When the components gets re-deployed, you should be able to eventually see the new fsm-ca-bundle secret in $fsm_namespace:
kubectl get secrets -n $fsm_namespace
NAME TYPE DATA AGE
fsm-ca-bundle Opaque 3 74m
The new expiration date can be found with the following command:
kubectl get secret -n $fsm_namespace $fsm_ca_bundle -o jsonpath='{.data.ca\.crt}' |
base64 -d |
openssl x509 -noout -dates
For the Sidecar service and validation certificates to be rotated the data plane components must restarted.
Hashicorp Vault and Certmanager
For certificate providers other than Tresor, the process of rotating the root certificate will be different. For Hashicorp Vault and cert-manager.io, users will need to rotate the root certificate themselves outside of FSM.
Issuing Certificates
Open Service Mesh supports 3 methods of issuing certificates:
- using an internal FSM package, called Tresor. This is the default for a first time installation.
- using Hashicorp Vault
- using cert-manager
Using FSM’s Tresor certificate issuer
FSM includes a package, tresor. This is a minimal implementation of the certificate.Manager interface. It issues certificates leveraging the crypto Go library, and stores these certificates as Kubernetes secrets.
To use the
tresorpackage during development setexport CERT_MANAGER=tresorin the.envfile of this repo.To use this package in your Kubernetes cluster set the
CERT_MANAGER=tresorvariable in the Helm chart prior to deployment.
Additionally:
fsm.caBundleSecretName- this string is the name of the Kubernetes secret, where the CA root certificate and private key will be saved.
Using Hashicorp Vault
Service Mesh operators, who consider storing their service mesh’s CA root key in Kubernetes insecure have the option to integrate with a Hashicorp Vault installation. In such scenarios a pre-configured Hashi Vault is required. Open Service Mesh’s control plane connects to the URL of the Vault, authenticates, and begins requesting certificates. This setup shifts the responsibility of correctly and securely configuring Vault to the operator.
The following configuration parameters will be required for FSM to integrate with an existing Vault installation:
- Vault address
- Vault token
- Validity period for certificates
fsm install set flag control how FSM integrates with Vault. The following fsm install set options must be configured to issue certificates with Vault:
--set fsm.certificateProvider.kind=vault- set this tovault--set fsm.vault.host- host name of the Vault server (example:vault.contoso.com)--set fsm.vault.protocol- protocol for Vault connection (httporhttps)--set fsm.vault.role- role created on Vault server and dedicated to Flomesh Service Mesh (example:fsm)--set fsm.certificateProvider.serviceCertValidityDuration- period for which each new certificate issued for service-to-service communication will be valid. It is represented as a sequence of decimal numbers each with optional fraction and a unit suffix, ex: 1h to represent 1 hour, 30m to represent 30 minutes, 1.5h or 1h30m to represent 1 hour and 30 minutes.
The Vault token must be provided to FSM so it can connect to Vault. The token can be configured as a set option or stored in a Kubernetes secret in the namespace of the FSM installation. If the fsm.vault.token option is not set, the fsm.vault.secret.name and fsm.vault.secret.key options must be configured.
--set fsm.vault.token- token to be used by FSM to connect to Vault (this is issued on the Vault server for the particular role)--set fsm.vault.secret.name- the string name of the Kubernetes secret storing the Vault token--set fsm.vault.secret.key- the key of the Vault token in the Kubernetes secret
Additionally:
fsm.caBundleSecretName- this string is the name of the Kubernetes secret where the service mesh root certificate will be stored. When using Vault (unlike Tresor) the root key will not be exported to this secret.
Installing Hashi Vault
Installation of Hashi Vault is out of scope for the Open Service Mesh project. Typically this is the responsibility of dedicated security teams. Documentation on how to deploy Vault securely and make it highly available is available on Vault’s website.
This repository does contain a script (deploy-vault.sh), which is used to automate the deployment of Hashi Vault for continuous integration. This is strictly for development purposes only. Running the script will deploy Vault in a Kubernetes namespace defined by the $K8S_NAMESPACE environment variable in your .env file. This script can be used for demonstration purposes. It requires the following environment variables:
export K8S_NAMESPACE=fsm-system-ns
export VAULT_TOKEN=xyz
Running the ./demo/deploy-vault.sh script will result in a dev Vault installation:
NAMESPACE NAME READY STATUS RESTARTS AGE
fsm-system-ns vault-5f678c4cc5-9wchj 1/1 Running 0 28s
Fetching the logs of the pod will show details on the Vault installation:
==> Vault server configuration:
Api Address: http://0.0.0.0:8200
Cgo: disabled
Cluster Address: https://0.0.0.0:8201
Listener 1: tcp (addr: "0.0.0.0:8200", cluster address: "0.0.0.0:8201", max_request_duration: "1m30s", max_request_size: "33554432", tls: "disabled")
Log Level: info
Mlock: supported: true, enabled: false
Recovery Mode: false
Storage: inmem
Version: Vault v1.4.0
WARNING! dev mode is enabled! In this mode, Vault runs entirely in-memory
and starts unsealed with a single unseal key. The root token is already
authenticated to the CLI, so you can immediately begin using Vault.
You may need to set the following environment variable:
$ export VAULT_ADDR='http://0.0.0.0:8200'
The unseal key and root token are displayed below in case you want to
seal/unseal the Vault or re-authenticate.
Unseal Key: cZzYxUaJaN10sa2UrPu7akLoyU6rKSXMcRt5dbIKlZ0=
Root Token: xyz
Development mode should NOT be used in production installations!
==> Vault server started! Log data will stream in below:
...
The outcome of deploying Vault in your system is a URL and a token. For instance the URL of Vault could be http://vault.<fsm-namespace>.svc.cluster.local and the token xxx.
Note:
<fsm-namespace>refers to the namespace where the fsm control plane is installed.
Configure FSM with Vault
After Vault installation and before we use Helm to deploy FSM, the following parameters must be provided provided in the Helm chart:
CERT_MANAGER=vault
VAULT_HOST="vault.${K8S_NAMESPACE}.svc.cluster.local"
VAULT_PROTOCOL=http
VAULT_TOKEN=xyz
VAULT_ROLE=fsm
When running FSM on your local workstation, use the following fsm install set options:
--set fsm.certificateProvider.kind="vault"
--set fsm.vault.host="localhost" # or the host where Vault is installed
--set fsm.vault.protocol="http"
--set fsm.vault.token="xyz"
--set fsm.vault.role="fsm'
--set fsm.serviceCertValidityDuration=24h
How FSM Integrates with Vault
When the FSM control plane starts, a new certificate issuer is instantiated.
The kind of cert issuer is determined by the fsm.certificateProvider.kind set option.
When this is set to vault FSM uses a Vault cert issuer.
This is a Hashicorp Vault client, which satisfies the certificate.Manager
interface. It provides the following methods:
- IssueCertificate - issues new certificates
- GetCertificate - retrieves a certificate given its Common Name (CN)
- RotateCertificate - rotates expiring certificates
- GetAnnouncementsChannel - returns a channel, which is used to announce when certificates have been issued or rotated
FSM assumes that a CA has already been created on the Vault server.
FSM also requires a dedicated Vault role (for instance pki/roles/fsm).
The Vault role created by the ./demo/deploy-vault.sh script applies the following configuration, which is only appropriate for development purposes:
allow_any_name:trueallow_subdomains:trueallow_baredomains:trueallow_localhost:truemax_ttl:24h
Hashi Vault’s site has excellent documentation
on how to create a new CA. The ./demo/deploy-vault.sh script uses the
following commands to setup the dev environment:
export VAULT_TOKEN="xyz"
export VAULT_ADDR="http://localhost:8200"
export VAULT_ROLE="fsm"
# Launch the Vault server in dev mode
vault server -dev -dev-listen-address=0.0.0.0:8200 -dev-root-token-id=${VAULT_TOKEN}
# Also save the token locally so this is available
echo $VAULT_TOKEN>~/.vault-token;
# Enable the PKI secrets engine (See: https://www.vaultproject.io/docs/secrets/pki#pki-secrets-engine)
vault secrets enable pki;
# Set the max lease TTL to a decade
vault secrets tune -max-lease-ttl=87600h pki;
# Set URL configuration (See: https://www.vaultproject.io/docs/secrets/pki#set-url-configuration)
vault write pki/config/urls issuing_certificates='http://127.0.0.1:8200/v1/pki/ca' crl_distribution_points='http://127.0.0.1:8200/v1/pki/crl';
# Configure a role named "fsm" (See: https://www.vaultproject.io/docs/secrets/pki#configure-a-role)
vault write pki/roles/${VAULT_ROLE} allow_any_name=true allow_subdomains=true;
# Create a root certificate named "fsm.root" (See: https://www.vaultproject.io/docs/secrets/pki#setup)
vault write pki/root/generate/internal common_name='fsm.root' ttl='87600h'
The FSM control plane provides verbose logs on operations done with the Vault installations.
Using cert-manager
cert-manager is another provider for issuing signed certificates to the FSM service mesh, without the need for storing private keys in Kubernetes. cert-manager has support for multiple issuer backends core to cert-manager, as well as pluggable external issuers.
Note that ACME certificates are not supported as an issuer for service mesh certificates.
When FSM requests certificates, it will create cert-manager
CertificateRequest
resources that are signed by the configured issuer.
Configure cert-manger for FSM signing
cert-manager must first be installed, with an issuer ready, before FSM can be installed using cert-manager as the certificate provider. You can find the installation documentation for cert-manager here.
Once cert-manager is installed, configure an issuer
resource to serve certificate
requests. It is recommended to use an Issuer resource kind (rather than a
ClusterIssuer) which should live in the FSM namespace (fsm-system by
default).
Once ready, it is required to store the root CA certificate of your issuer
as a Kubernetes secret in the FSM namespace (fsm-system by default) at the
ca.crt key. The target CA secret name can be configured on FSM using
fsm install --set fsm.caBundleSecretName=my-secret-name (typically fsm-ca-bundle).
kubectl create secret -n fsm-system generic fsm-ca-bundle --from-file ca.crt
Refer to the cert-manager demo to learn more.
Configure FSM with cert-manager
In order for FSM to use cert-manager with the configured issuer, set the
following CLI arguments on the fsm install command:
--set fsm.certificateProvider.kind="cert-manager"- Required to use cert-manager as the provider.--set fsm.certmanager.issuerName- The name of the [Cluster]Issuer resource (defaulted tofsm-ca).--set fsm.certmanager.issuerKind- The kind of issuer (eitherIssuerorClusterIssuer, defaulted toIssuer).--set fsm.certmanager.issuerGroup- The group that the issuer belongs to (defaulted tocert-manager.iowhich is all core issuer types).
7.4 - Traffic Access Control
Traffic Access Control
The SMI Traffic Access Control API can be used to configure access to specific pods and routes based on the identity of a client for locking down applications to only allowed users and services. This allow users to define access control policy for their application based on service identity using Kubernetes service accounts.
Traffic Access Control API handles the authorization side only.
What is supported
FSM implements the SMI Traffic Access Control v1alpha3 version.
It supports the following:
- SMI access control policies to authorize traffic access between service identities
- SMI traffic specs policies to define routing rules to associate with access control policies
How it works
A TrafficTarget associates a set of traffic definitions (rules) with a service identity which is allocated to a group of pods. Access is controlled
via referenced TrafficSpecs and by a list of source service identities. If a pod which holds the reference service identity makes a call to the destination on one of the defined routes then access will be allowed. Any pod which attempts to connect and is not in
the defined list of sources will be denied. Any pod which is in the defined list but attempts to connect on a route which is not in the list of TrafficSpecs will be denied.
kind: TCPRoute
metadata:
name: the-routes
spec:
matches:
ports:
- 8080
---
kind: HTTPRouteGroup
metadata:
name: the-routes
spec:
matches:
- name: metrics
pathRegex: "/metrics"
methods:
- GET
- name: everything
pathRegex: ".*"
methods: ["*"]
For this definition, there are two routes: metrics and everything. It is a common use case to restrict access to /metrics to only be scraped by Prometheus. To define the target for this traffic, it takes a TrafficTarget.
---
kind: TrafficTarget
metadata:
name: path-specific
namespace: default
spec:
destination:
kind: ServiceAccount
name: service-a
namespace: default
rules:
- kind: TCPRoute
name: the-routes
- kind: HTTPRouteGroup
name: the-routes
matches:
- metrics
sources:
- kind: ServiceAccount
name: prometheus
namespace: default
This example selects all the pods which have the service-a ServiceAccount. Traffic destined on a path /metrics is allowed. The matches field is
optional and if omitted, a rule is valid for all the matches in a traffic spec (a OR relationship). It is possible for a service to expose multiple ports,
the TCPRoute/UDPRoute matches.ports field allows the user to specify specifically which port traffic should be allowed on. The matches.ports is an optional element, if not specified, traffic will be allowed to all ports on the destination service.
Allowing destination traffic should only be possible with permission of the service owner. Therefore, RBAC rules should be configured to control the pods
which are allowed to assign the ServiceAccount defined in the TrafficTarget destination.
Note: access control is always enforced on the server side of a connection (or the target). It is up to implementations to decide whether they would also like to enforce access control on the client (or source) side of the connection as well.
Source identities which are allowed to connect to the destination is defined in the sources list. Only pods which have a ServiceAccount which is named in the sources list are allowed to connect to the destination.
Example implementation for L7
The following implementation shows four services api, website, payment and prometheus. It shows how it is possible to write fine grained TrafficTargets which allow access to be controlled by route and source.
kind: TCPRoute
metadata:
name: api-service-port
spec:
matches:
ports:
- 8080
---
kind: HTTPRouteGroup
metadata:
name: api-service-routes
spec:
matches:
- name: api
pathRegex: /api
methods: ["*"]
- name: metrics
pathRegex: /metrics
methods: ["GET"]
---
kind: TrafficTarget
metadata:
name: api-service-metrics
namespace: default
spec:
destination:
kind: ServiceAccount
name: api-service
namespace: default
rules:
- kind: TCPRoute
name: api-service-port
- kind: HTTPRouteGroup
name: api-service-routes
matches:
- metrics
sources:
- kind: ServiceAccount
name: prometheus
namespace: default
---
kind: TrafficTarget
metadata:
name: api-service-api
namespace: default
spec:
destination:
kind: ServiceAccount
name: api-service
namespace: default
rules:
- kind: TCPRoute
name: api-service-port
- kind: HTTPRouteGroup
name: api-service-routes
matches:
- api
sources:
- kind: ServiceAccount
name: website-service
namespace: default
- kind: ServiceAccount
name: payments-service
namespace: default
The previous example would allow the following HTTP traffic:
| source | destination | path | method |
|---|---|---|---|
| website-service | api-service | /api | * |
| payments-service | api-service | /api | * |
| prometheus | api-service | /metrics | GET |
Example implementation for L4
The following implementation shows how to define TrafficTargets for allowing TCP and UDP traffic to specific ports.
kind: TCPRoute
metadata:
name: tcp-ports
spec:
matches:
ports:
- 8301
- 8302
- 8300
---
kind: UDPRoute
metadata:
name: udp-ports
spec:
matches:
ports:
- 8301
- 8302
---
kind: TrafficTarget
metadata:
name: protocal-specific
spec:
destination:
kind: ServiceAccount
name: server
namespace: default
rules:
- kind: TCPRoute
name: tcp-ports
- kind: UDPRoute
name: udp-ports
sources:
- kind: ServiceAccount
name: client
namespace: default
Above configuration will allow TCP and UDP traffic to both
8301and8302ports, but will block UDP traffic to8300.
Refer to a guide on configure traffic policies to learn more.
8 - Troubleshooting
8.1 - Application Container Lifecycle
Since FSM injects application pods that are a part of the service mesh with a long-running sidecar proxy and sets up traffic redirection rules to route all traffic to/from pods via the sidecar proxy, in some circumstances existing application containers might not startup or shutdown as expected.
When the application container depends on network connectivity at startup
Application containers that depend on network connectivity at startup are likely to experience issues once the Pipy sidecar proxy container and the fsm-init init container are injected into the application pod by FSM. This is because upon sidecar injection, all TCP based network traffic from application containers are routed to the sidecar proxy and subject to service mesh traffic policies. This implies that for application traffic to be routed as it would without the sidecar proxy container injected, FSM controller must first program the sidecar proxy on the application pod to allow such traffic. Without the Pipy sidecar proxy being configured, all traffic from application containers will be dropped.
When FSM is configured with permissive traffic policy mode enabled, FSM will program wildcard traffic policy rules on the Pipy sidecar proxy to allow every pod to access all services that are a part of the mesh. When FSM is configured with SMI traffic policy mode enabled, explicit SMI policies must be configured to enable communication between applications in the mesh.
Regardless of the traffic policy mode, application containers that depend on network connectivity at startup can experience problems starting up if they are not resilient to delays in the network being ready. With the Pipy proxy sidecar injected, the network is deemed ready only when the sidecar proxy has been programmed by FSM controller to allow application traffic to flow through the network.
It is recommended that application containers be resilient enough to the initial bootstrapping phase of the Pipy proxy sidecar in the application pod.
It is important to note that the container’s restart policy also influences the startup of application containers. If an application container’s startup policy is set to Never and it depends on network connectivity to be ready at startup time, it is possible the container fails to access the network until the Pipy proxy sidecar is ready to allow the application container access to the network, thereby resulting in the application container to exit and never recover from a failed startup. For this reason, it is recommended not to use a container restart policy of Never if your application container depends on network connectivity at startup.
Related issues (work in progress)
- Kubernetes issue 65502: Support startup dependencies between containers on the same pod
8.2 - Error Codes
Error Code Descriptions
If error codes are present in the FSM error logs or detected from the FSM error code metrics, the fsm support error-info cli tool can be used gain more information about the error code.
The following table is generated by running fsm support error-info.
+------------+----------------------------------------------------------------------------------+
| ERROR CODE | DESCRIPTION |
+------------+----------------------------------------------------------------------------------+
| E1000 | An invalid command line argument was passed to the application. |
+------------+----------------------------------------------------------------------------------+
| E1001 | The specified log level could not be set in the system. |
+------------+----------------------------------------------------------------------------------+
| E1002 | The fsm-controller k8s pod resource was not able to be retrieved by the system. |
+------------+----------------------------------------------------------------------------------+
| E1003 | The fsm-injector k8s pod resource was not able to be retrieved by the system. |
+------------+----------------------------------------------------------------------------------+
| E1004 | The Ingress client created by the fsm-controller to monitor Ingress resources |
| | failed to start. |
+------------+----------------------------------------------------------------------------------+
| E1005 | The Reconciler client to monitor updates and deletes to FSM's CRDs and mutating |
| | webhook failed to start. |
+------------+----------------------------------------------------------------------------------+
| E2000 | An error was encountered while attempting to deduplicate traffic matching |
| | attributes (destination port, protocol, IP address etc.) used for matching |
| | egress traffic. The applied egress policies could be conflicting with each |
| | other, and the system was unable to process affected egress policies. |
+------------+----------------------------------------------------------------------------------+
| E2001 | An error was encountered while attempting to deduplicate upstream clusters |
| | associated with the egress destination. The applied egress policies could be |
| | conflicting with each other, and the system was unable to process affected |
| | egress policies. |
+------------+----------------------------------------------------------------------------------+
| E2002 | An invalid IP address range was specified in the egress policy. The IP address |
| | range must be specified as as a CIDR notation IP address and prefix length, like |
| | "192.0.2.0/24", as defined in RFC 4632. The invalid IP address range was ignored |
| | by the system. |
+------------+----------------------------------------------------------------------------------+
| E2003 | An invalid match was specified in the egress policy. The specified match was |
| | ignored by the system while applying the egress policy. |
+------------+----------------------------------------------------------------------------------+
| E2004 | The SMI HTTPRouteGroup resource specified as a match in an egress policy was not |
| | found. Please verify that the specified SMI HTTPRouteGroup resource exists in |
| | the same namespace as the egress policy referencing it as a match. |
+------------+----------------------------------------------------------------------------------+
| E2005 | The SMI HTTPRouteGroup resources specified as a match in an SMI TrafficTarget |
| | policy was unable to be retrieved by the system. The associated SMI |
| | TrafficTarget policy was ignored by the system. Please verify that the matches |
| | specified for the Traffictarget resource exist in the same namespace as the |
| | TrafficTarget policy referencing the match. |
+------------+----------------------------------------------------------------------------------+
| E2006 | The SMI HTTPRouteGroup resource is invalid as it does not have any matches |
| | specified. The SMI HTTPRouteGroup policy was ignored by the system. |
+------------+----------------------------------------------------------------------------------+
| E2007 | There are multiple SMI traffic split policies associated with the same |
| | apex(root) service specified in the policies. The system does not support |
| | this scenario so onlt the first encountered policy is processed by the system, |
| | subsequent policies referring the same apex service are ignored. |
+------------+----------------------------------------------------------------------------------+
| E2008 | There was an error adding a route match to an outbound traffic policy |
| | representation within the system. The associated route was ignored by the |
| | system. |
+------------+----------------------------------------------------------------------------------+
| E2009 | The inbound TrafficTargets composed of their routes for a given destination |
| | ServiceIdentity could not be configured. |
+------------+----------------------------------------------------------------------------------+
| E2010 | An applied SMI TrafficTarget policy has an invalid destination kind. |
+------------+----------------------------------------------------------------------------------+
| E2011 | An applied SMI TrafficTarget policy has an invalid source kind. |
+------------+----------------------------------------------------------------------------------+
| E3000 | The system found 0 endpoints to be reached when the service's FQDN was resolved. |
+------------+----------------------------------------------------------------------------------+
| E3001 | A Kubernetes resource could not be marshalled. |
+------------+----------------------------------------------------------------------------------+
| E3002 | A Kubernetes resource could not be unmarshalled. |
+------------+----------------------------------------------------------------------------------+
| E4000 | The Kubernetes secret containing the certificate could not be retrieved by the |
| | system. |
+------------+----------------------------------------------------------------------------------+
| E4001 | The certificate specified by name could not be obtained by key from the secret's |
| | data. |
+------------+----------------------------------------------------------------------------------+
| E4002 | The private key specified by name could not be obtained by key from the secret's |
| | data. |
+------------+----------------------------------------------------------------------------------+
| E4003 | The certificate expiration specified by name could not be obtained by key from |
| | the secret's data. |
+------------+----------------------------------------------------------------------------------+
| E4004 | The certificate expiration obtained from the secret's data by name could not be |
| | parsed. |
+------------+----------------------------------------------------------------------------------+
| E4005 | The secret containing a certificate could not be created by the system. |
+------------+----------------------------------------------------------------------------------+
| E4006 | A private key failed to be generated. |
+------------+----------------------------------------------------------------------------------+
| E4007 | The specified private key could be be could not be converted from a DER encoded |
| | key to a PEM encoded key. |
+------------+----------------------------------------------------------------------------------+
| E4008 | The certificate request fails to be created when attempting to issue a |
| | certificate. |
+------------+----------------------------------------------------------------------------------+
| E4009 | When creating a new certificate authority, the root certificate could not be |
| | obtained by the system. |
+------------+----------------------------------------------------------------------------------+
| E4010 | The specified certificate could not be converted from a DER encoded certificate |
| | to a PEM encoded certificate. |
+------------+----------------------------------------------------------------------------------+
| E4011 | The specified PEM encoded certificate could not be decoded. |
+------------+----------------------------------------------------------------------------------+
| E4012 | The specified PEM privateKey for the certificate authority's root certificate |
| | could not be decoded. |
+------------+----------------------------------------------------------------------------------+
| E4013 | An unspecified error occurred when issuing a certificate from the certificate |
| | manager. |
+------------+----------------------------------------------------------------------------------+
| E4014 | An error occurred when creating a certificate to issue from the certificate |
| | manager. |
+------------+----------------------------------------------------------------------------------+
| E4015 | The certificate authority privided when issuing a certificate was invalid. |
+------------+----------------------------------------------------------------------------------+
| E4016 | The specified certificate could not be rotated. |
+------------+----------------------------------------------------------------------------------+
| E4100 | Failed parsing object into PubSub message. |
+------------+----------------------------------------------------------------------------------+
| E4150 | Failed initial cache sync for config.flomesh.io informer. |
+------------+----------------------------------------------------------------------------------+
| E4151 | Failed to cast object to MeshConfig. |
+------------+----------------------------------------------------------------------------------+
| E4152 | Failed to fetch MeshConfig from cache with specific key. |
+------------+----------------------------------------------------------------------------------+
| E4153 | Failed to marshal MeshConfig into other format. |
+------------+----------------------------------------------------------------------------------+
| E5000 | A XDS resource could not be marshalled. |
+------------+----------------------------------------------------------------------------------+
| E5001 | The XDS certificate common name could not be parsed. The CN should be of the |
| | form <proxy-UUID>.<kind>.<proxy-identity>. |
+------------+----------------------------------------------------------------------------------+
| E5002 | The proxy UUID obtained from parsing the XDS certificate's common name did not |
| | match the fsm-proxy-uuid label value for any pod. The pod associated with the |
| | specified Pipy proxy could not be found. |
+------------+----------------------------------------------------------------------------------+
| E5003 | A pod in the mesh belongs to more than one service. By Open Service Mesh |
| | convention the number of services a pod can belong to is 1. This is a limitation |
| | we set in place in order to make the mesh easy to understand and reason about. |
| | When a pod belongs to more than one service XDS will not program the Pipy |
| | proxy, leaving it out of the mesh. |
+------------+----------------------------------------------------------------------------------+
| E5004 | The Pipy proxy data structure created by ADS to reference an Pipy proxy |
| | sidecar from a pod's fsm-proxy-uuid label could not be configured. |
+------------+----------------------------------------------------------------------------------+
| E5005 | A GRPC connection failure occurred and the ADS is no longer able to receive |
| | DiscoveryRequests. |
+------------+----------------------------------------------------------------------------------+
| E5006 | The DiscoveryResponse configured by ADS failed to send to the Pipy proxy. |
+------------+----------------------------------------------------------------------------------+
| E5007 | The resources to be included in the DiscoveryResponse could not be generated. |
+------------+----------------------------------------------------------------------------------+
| E5008 | The aggregated resources generated for a DiscoveryResponse failed to be |
| | configured as a new snapshot in the Pipy xDS Aggregate Discovery Services |
| | cache. |
+------------+----------------------------------------------------------------------------------+
| E5009 | The Aggregate Discovery Server (ADS) created by the FSM controller failed to |
| | start. |
+------------+----------------------------------------------------------------------------------+
| E5010 | The ServiceAccount referenced in the NodeID does not match the ServiceAccount |
| | specified in the proxy certificate. The proxy was not allowed to be a part of |
| | the mesh. |
+------------+----------------------------------------------------------------------------------+
| E5011 | The gRPC stream was closed by the proxy and no DiscoveryRequests can be |
| | received. The Stream Agreggated Resource server was terminated for the specified |
| | proxy. |
+------------+----------------------------------------------------------------------------------+
| E5012 | The sidecar proxy has not completed the initialization phase and it is not ready |
| | to receive broadcast updates from control plane related changes. New versions |
| | should not be pushed if the first request has not be received. The broadcast |
| | update was ignored for that proxy. |
+------------+----------------------------------------------------------------------------------+
| E5013 | The TypeURL of the resource being requested in the DiscoveryRequest is invalid. |
+------------+----------------------------------------------------------------------------------+
| E5014 | The version of the DiscoveryRequest could not be parsed by ADS. |
+------------+----------------------------------------------------------------------------------+
| E5015 | A proxy egress cluster which routes traffic to its original destination could |
| | not be configured. When a Host is not specified in the cluster config, the |
| | original destination is used. |
+------------+----------------------------------------------------------------------------------+
| E5016 | A proxy egress cluster that routes traffic based on the specified Host resolved |
| | using DNS could not be configured. |
+------------+----------------------------------------------------------------------------------+
| E5017 | A proxy cluster that corresponds to a specified upstream service could not be |
| | configured. |
+------------+----------------------------------------------------------------------------------+
| E5018 | The meshed services corresponding a specified Pipy proxy could not be listed. |
+------------+----------------------------------------------------------------------------------+
| E5019 | Multiple Pipy clusters with the same name were configured. The duplicate |
| | clusters will not be sent to the Pipy proxy in a ClusterDiscovery response. |
+------------+----------------------------------------------------------------------------------+
| E5020 | The application protocol specified for a port is not supported for ingress |
| | traffic. The XDS filter chain for ingress traffic to the port was not created. |
+------------+----------------------------------------------------------------------------------+
| E5021 | An XDS filter chain could not be constructed for ingress. |
+------------+----------------------------------------------------------------------------------+
| E5022 | A traffic policy rule could not be configured as an RBAC rule on the proxy. |
| | The corresponding rule was ignored by the system. |
+------------+----------------------------------------------------------------------------------+
| E5023 | The SDS certificate resource could not be unmarshalled. The |
| | corresponding certificate resource was ignored by the system. |
+------------+----------------------------------------------------------------------------------+
| E5024 | An XDS secret containing a TLS certificate could not be retrieved. |
| | The corresponding secret request was ignored by the system. |
+------------+----------------------------------------------------------------------------------+
| E5025 | The SDS secret does not correspond to a MeshService. |
+------------+----------------------------------------------------------------------------------+
| E5026 | The SDS secret does not correspond to a ServiceAccount. |
+------------+----------------------------------------------------------------------------------+
| E5027 | The identity obtained from the SDS certificate request does not match the |
| | The corresponding secret request was ignored by the system. |
+------------+----------------------------------------------------------------------------------+
| E5028 | The SDS secret does not correspond to a MeshService. |
+------------+----------------------------------------------------------------------------------+
| E5029 | The SDS secret does not correspond to a ServiceAccount. |
+------------+----------------------------------------------------------------------------------+
| E5030 | The identity obtained from the SDS certificate request does not match the |
| | identity of the proxy. The corresponding certificate request was ignored |
| | by the system. |
+------------+----------------------------------------------------------------------------------+
| E6100 | A protobuf ProtoMessage could not be converted into YAML. |
+------------+----------------------------------------------------------------------------------+
| E6101 | The mutating webhook certificate could not be parsed. |
| | The mutating webhook HTTP server was not started. |
+------------+----------------------------------------------------------------------------------+
| E6102 | The sidecar injection webhook HTTP server failed to start. |
+------------+----------------------------------------------------------------------------------+
| E6103 | An AdmissionRequest could not be decoded. |
+------------+----------------------------------------------------------------------------------+
| E6104 | The timeout from an AdmissionRequest could not be parsed. |
+------------+----------------------------------------------------------------------------------+
| E6105 | The AdmissionRequest's header was invalid. The content type obtained from the |
| | header is not supported. |
+------------+----------------------------------------------------------------------------------+
| E6106 | The AdmissionResponse could not be written. |
+------------+----------------------------------------------------------------------------------+
| E6107 | The AdmissionRequest was empty. |
+------------+----------------------------------------------------------------------------------+
| E6108 | It could not be determined if the pod specified in the AdmissionRequest is |
| | enabled for sidecar injection. |
+------------+----------------------------------------------------------------------------------+
| E6109 | It could not be determined if the namespace specified in the |
| | AdmissionRequest is enabled for sidecar injection. |
+------------+----------------------------------------------------------------------------------+
| E6110 | The port exclusions for a pod could not be obtained. No |
| | port exclusions are added to the init container's spec. |
+------------+----------------------------------------------------------------------------------+
| E6111 | The AdmissionRequest body could not be read. |
+------------+----------------------------------------------------------------------------------+
| E6112 | The AdmissionRequest body was nil. |
+------------+----------------------------------------------------------------------------------+
| E6113 | The MutatingWebhookConfiguration could not be created. |
+------------+----------------------------------------------------------------------------------+
| E6114 | The MutatingWebhookConfiguration could not be updated. |
+------------+----------------------------------------------------------------------------------+
| E6700 | An error occurred when shutting down the validating webhook HTTP server. |
+------------+----------------------------------------------------------------------------------+
| E6701 | The validating webhook HTTP server failed to start. |
+------------+----------------------------------------------------------------------------------+
| E6702 | The validating webhook certificate could not be parsed. |
| | The validating webhook HTTP server was not started. |
+------------+----------------------------------------------------------------------------------+
| E6703 | The ValidatingWebhookConfiguration could not be created. |
+------------+----------------------------------------------------------------------------------+
| E7000 | An error occurred while reconciling the updated CRD to its original state. |
+------------+----------------------------------------------------------------------------------+
| E7001 | An error occurred while reconciling the deleted CRD. |
+------------+----------------------------------------------------------------------------------+
| E7002 | An error occurred while reconciling the updated mutating webhook to its original |
| | state. |
+------------+----------------------------------------------------------------------------------+
| E7003 | An error occurred while reconciling the deleted mutating webhook. |
+------------+----------------------------------------------------------------------------------+
| E7004 | An error occurred while while reconciling the updated validating webhook to its |
| | original state. |
+------------+----------------------------------------------------------------------------------+
| E7005 | An error occurred while reconciling the deleted validating webhook. |
+------------+----------------------------------------------------------------------------------+
Information for a specific error code can be obtained by running fsm support error-info <error-code>. For example:
fsm support error-info E1000
+------------+-----------------------------------------------------------------+
| ERROR CODE | DESCRIPTION |
+------------+-----------------------------------------------------------------+
| E1000 | An invalid command line argument was passed to the |
| | application. |
+------------+-----------------------------------------------------------------+
8.3 - Prometheus
Prometheus is unreachable
If a Prometheus instance installed with FSM can’t be reached, perform the following steps to identify and resolve any issues.
Verify a Prometheus Pod exists.
When installed with
fsm install --set=fsm.deployPrometheus=true, a Prometheus Pod named something likefsm-prometheus-5794755b9f-rnvlrshould exist in the namespace of the other FSM control plane components which namedfsm-systemby default.If no such Pod is found, verify the FSM Helm chart was installed with the
fsm.deployPrometheusparameter set totruewithhelm:$ helm get values -a <mesh name> -n <FSM namespace>If the parameter is set to anything but
true, reinstall FSM with the--set=fsm.deployPrometheus=trueflag onfsm install.Verify the Prometheus Pod is healthy.
The Prometheus Pod identified above should be both in a Running state and have all containers ready, as shown in the
kubectl getoutput:$ # Assuming FSM is installed in the fsm-system namespace: $ kubectl get pods -n fsm-system -l app=fsm-prometheus NAME READY STATUS RESTARTS AGE fsm-prometheus-5794755b9f-67p6r 1/1 Running 0 27mIf the Pod is not showing as Running or its containers ready, use
kubectl describeto look for other potential issues:$ # Assuming FSM is installed in the fsm-system namespace: $ kubectl describe pods -n fsm-system -l app=fsm-prometheusOnce the Prometheus Pod is found to be healthy, Prometheus should be reachable.
Metrics are not showing up in Prometheus
If Prometheus is found not to be scraping metrics for any Pods, perform the following steps to identify and resolve any issues.
Verify application Pods are working as expected.
If workloads running in the mesh are not functioning properly, metrics scraped from those Pods may not look correct. For example, if metrics showing traffic to Service A from Service B are missing, ensure the services are communicating successfully.
To help further troubleshoot these kinds of issues, see the traffic troubleshooting guide.
Verify the Pods whose metrics are missing have an Pipy sidecar injected.
Only Pods with an Pipy sidecar container are expected to have their metrics scraped by Prometheus. Ensure each Pod is running a container from an image with
flomesh/pipyin its name:$ kubectl get po -n <pod namespace> <pod name> -o jsonpath='{.spec.containers[*].image}' mynamespace/myapp:v1.0.0 flomesh/pipy:0.50.0Verify the proxy’s endpoint being scraped by Prometheus is working as expected.
Each Pipy proxy exposes an HTTP endpoint that shows metrics generated by that proxy and is scraped by Prometheus. Check to see if the expected metrics are shown by making a request to the endpoint directly.
For each Pod whose metrics are missing, use
kubectlto forward the Pipy proxy admin interface port and check the metrics:$ kubectl port-forward -n <pod namespace> <pod name> 15000Go to http://localhost:15000/stats/prometheus in a browser to check the metrics generated by that Pod. If Prometheus does not seem to be accounting for these metrics, move on to the next step to ensure Prometheus is configured properly.
Verify the intended namespaces have been enrolled in metrics collection.
For each namespace that contains Pods which should have metrics scraped, ensure the namespace is monitored by the intended FSM instance with
fsm mesh list.Next, check to make sure the namespace is annotated with
flomesh.io/metrics: enabled:$ # Assuming FSM is installed in the fsm-system namespace: $ kubectl get namespace <namespace> -o jsonpath='{.metadata.annotations.flomesh\.io/metrics}' enabledIf no such annotation exists on the namespace or it has a different value, fix it with
fsm:$ fsm metrics enable --namespace <namespace> Metrics successfully enabled in namespace [<namespace>]If custom metrics are not being scraped, verify they have been enabled.
Custom metrics are currently disable by default and enabled when the
fsm.featureFlags.enableWASMStatsparameter is set totrue. Verify the current FSM instance has this parameter set for a mesh named<fsm-mesh-name>in the<fsm-namespace>namespace:$ helm get values -a <fsm-mesh-name> -n <fsm-namespace>Note: replace
<fsm-mesh-name>with the name of the fsm mesh and<fsm-namespace>with the namespace where fsm was installed.If
fsm.featureFlags.enableWASMStatsis set to a different value, reinstall FSM and pass--set fsm.featureFlags.enableWASMStatstofsm install.
8.4 - Grafana
Grafana is unreachable
If a Grafana instance installed with FSM can’t be reached, perform the following steps to identify and resolve any issues.
Verify a Grafana Pod exists.
When installed with
fsm install --set=fsm.deployGrafana=true, a Grafana Pod named something likefsm-grafana-7c88b9687d-tlzldshould exist in the namespace of the other FSM control plane components which namedfsm-systemby default.If no such Pod is found, verify the FSM Helm chart was installed with the
fsm.deployGrafanaparameter set totruewithhelm:$ helm get values -a <mesh name> -n <FSM namespace>If the parameter is set to anything but
true, reinstall FSM with the--set=fsm.deployGrafana=trueflag onfsm install.Verify the Grafana Pod is healthy.
The Grafana Pod identified above should be both in a Running state and have all containers ready, as shown in the
kubectl getoutput:$ # Assuming FSM is installed in the fsm-system namespace: $ kubectl get pods -n fsm-system -l app=fsm-grafana NAME READY STATUS RESTARTS AGE fsm-grafana-7c88b9687d-tlzld 1/1 Running 0 58sIf the Pod is not showing as Running or its containers ready, use
kubectl describeto look for other potential issues:$ # Assuming FSM is installed in the fsm-system namespace: $ kubectl describe pods -n fsm-system -l app=fsm-grafanaOnce the Grafana Pod is found to be healthy, Grafana should be reachable.
Dashboards show no data in Grafana
If data appears to be missing from the Grafana dashboards, perform the following steps to identify and resolve any issues.
Verify Prometheus is installed and healthy.
Because Grafana queries Prometheus for data, ensure Prometheus is working as expected. See the Prometheus troubleshooting guide for more details.
Verify Grafana can communicate with Prometheus.
Start by opening the Grafana UI in a browser:
$ fsm dashboard [+] Starting Dashboard forwarding [+] Issuing open browser http://localhost:3000Login (default username/password is admin/admin) and navigate to the data source settings. For each data source that may not be working, click it to see its configuration. At the bottom of the page is a “Save & Test” button that will verify the settings.
If an error occurs, verify the Grafana configuration to ensure it is correctly pointing to the intended Prometheus instance. Make changes in the Grafana settings as necessary until the “Save & Test” check shows no errors:

More details about configuring data sources can be found in Grafana’s docs.
For other possible issues, see Grafana’s troubleshooting documentation.
8.5 - Uninstall
If for any reason, fsm uninstall mesh (as documented in the uninstall guide) fails, you may manually delete FSM resources as detailed below.
Set environment variables for your mesh:
export fsm_namespace=fsm-system # Replace fsm-system with the namespace where FSM is installed
export mesh_name=fsm # Replace fsm with the FSM mesh name
export fsm_version=<fsm version>
export fsm_ca_bundle=<fsm ca bundle>
Delete FSM control plane deployments:
kubectl delete deployment -n $fsm_namespace fsm-bootstrap
kubectl delete deployment -n $fsm_namespace fsm-controller
kubectl delete deployment -n $fsm_namespace fsm-injector
If FSM was installed alongside Prometheus, Grafana, or Jaeger, delete those deployments:
kubectl delete deployment -n $fsm_namespace fsm-prometheus
kubectl delete deployment -n $fsm_namespace fsm-grafana
kubectl delete deployment -n $fsm_namespace jaeger
If FSM was installed with the FSM Multicluster Gateway, delete it by running the following:
kubectl delete deployment -n $fsm_namespace fsm-multicluster-gateway
Delete FSM secrets, the meshconfig, and webhook configurations:
Warning: Ensure that no resources in the cluster depend on the following resources before proceeding.
kubectl delete secret -n $fsm_namespace $fsm_ca_bundle mutating-webhook-cert-secret validating-webhook-cert-secret crd-converter-cert-secret
kubectl delete meshconfig -n $fsm_namespace fsm-mesh-config
kubectl delete mutatingwebhookconfiguration -l app.kubernetes.io/name=flomesh.io,app.kubernetes.io/instance=$mesh_name,app.kubernetes.io/version=$fsm_version,app=fsm-injector
kubectl delete validatingwebhookconfiguration -l app.kubernetes.io/name=flomesh.io,app.kubernetes.io/instance=mesh_name,app.kubernetes.io/version=$fsm_version,app=fsm-controller
To delete FSM and SMI CRDs from the cluster, run the following.
Warning: Deletion of a CRD will cause all custom resources corresponding to that CRD to also be deleted.
kubectl delete crd meshconfigs.config.flomesh.io
kubectl delete crd multiclusterservices.config.flomesh.io
kubectl delete crd egresses.policy.flomesh.io
kubectl delete crd ingressbackends.policy.flomesh.io
kubectl delete crd httproutegroups.specs.smi-spec.io
kubectl delete crd tcproutes.specs.smi-spec.io
kubectl delete crd traffictargets.access.smi-spec.io
kubectl delete crd trafficsplits.split.smi-spec.io
8.6 - Traffic Troubleshooting
Table of Contents
8.6.1 - Iptables Redirection
When traffic redirection is not working as expected
1. Confirm the pod has the Pipy sidecar container injected
The application pod should be injected with the Pipy proxy sidecar for traffic redirection to work as expected. Confirm this by ensuring the application pod is running and has the Pipy proxy sidecar container in ready state.
kubectl get pod test-58d4f8ff58-wtz4f -n test
NAME READY STATUS RESTARTS AGE
test-58d4f8ff58-wtz4f 2/2 Running 0 32s
2. Confirm FSM’s init container has finished runnning successfully
FSM’s init container fsm-init is responsible for initializing individual application pods in the service mesh with traffic redirection rules to proxy application traffic via the Pipy proxy sidecar. The traffic redirection rules are set up using a set of iptables commands that run before any application containers in the pod are running.
Confirm FSM’s init container has finished running successfully by running kubectl describe on the application pod, and verifying the fsm-init container has terminated with an exit code of 0. The container’s State property provides this information.
kubectl describe pod test-58d4f8ff58-wtz4f -n test
Name: test-58d4f8ff58-wtz4f
Namespace: test
...
...
Init Containers:
fsm-init:
Container ID: containerd://98840f655f2310b2f441e11efe9dfcf894e4c57e4e26b928542ee698159100c0
Image: flomesh/init:2c18593efc7a31986a6ae7f412e73b6067e11a57
Image ID: docker.io/flomesh/init@sha256:24456a8391bce5d254d5a1d557d0c5e50feee96a48a9fe4c622036f4ab2eaf8e
Port: <none>
Host Port: <none>
Command:
/bin/sh
Args:
-c
iptables -t nat -N PROXY_INBOUND && iptables -t nat -N PROXY_IN_REDIRECT && iptables -t nat -N PROXY_OUTPUT && iptables -t nat -N PROXY_REDIRECT && iptables -t nat -A PROXY_REDIRECT -p tcp -j REDIRECT --to-port 15001 && iptables -t nat -A PROXY_REDIRECT -p tcp --dport 15000 -j ACCEPT && iptables -t nat -A OUTPUT -p tcp -j PROXY_OUTPUT && iptables -t nat -A PROXY_OUTPUT -m owner --uid-owner 1500 -j RETURN && iptables -t nat -A PROXY_OUTPUT -d 127.0.0.1/32 -j RETURN && iptables -t nat -A PROXY_OUTPUT -j PROXY_REDIRECT && iptables -t nat -A PROXY_IN_REDIRECT -p tcp -j REDIRECT --to-port 15003 && iptables -t nat -A PREROUTING -p tcp -j PROXY_INBOUND && iptables -t nat -A PROXY_INBOUND -p tcp --dport 15010 -j RETURN && iptables -t nat -A PROXY_INBOUND -p tcp --dport 15901 -j RETURN && iptables -t nat -A PROXY_INBOUND -p tcp --dport 15902 -j RETURN && iptables -t nat -A PROXY_INBOUND -p tcp --dport 15903 -j RETURN && iptables -t nat -A PROXY_INBOUND -p tcp -j PROXY_IN_REDIRECT
State: Terminated
Reason: Completed
Exit Code: 0
Started: Mon, 22 Mar 2021 09:26:14 -0700
Finished: Mon, 22 Mar 2021 09:26:14 -0700
Ready: True
Restart Count: 0
Environment: <none>
Mounts:
/var/run/secrets/kubernetes.io/serviceaccount from frontend-token-5g488 (ro)
When outbound IP range exclusions are configured
By default, all traffic using TCP as the underlying transport protocol are redirected via the Pipy proxy sidecar container. This means all TCP based outbound traffic from applications are redirected and routed via the Pipy proxy sidecar based on service mesh policies. When outbound IP range exclusions are configured, traffic belonging to these IP ranges will not be proxied to the Pipy sidecar.
If outbound IP ranges are configured to be excluded but being subject to service mesh policies, verify they are configured as expected.
1. Confirm outbound IP ranges are correctly configured in the fsm-mesh-config MeshConfig resource
Confirm the outbound IP ranges to be excluded are set correctly:
# Assumes FSM is installed in the fsm-system namespace
kubectl get meshconfig fsm-mesh-config -n fsm-system -o jsonpath='{.spec.traffic.outboundIPRangeExclusionList}{"\n"}'
["1.1.1.1/32","2.2.2.2/24"]
The output shows the IP ranges that are excluded from outbound traffic redirection, ["1.1.1.1/32","2.2.2.2/24"] in the example above.
2. Confirm outbound IP ranges are included in init container spec
When outbound IP range exclusions are configured, FSM’s fsm-injector service reads this configuration from the fsm-mesh-config MeshConfig resource and programs iptables rules corresponding to these ranges so that they are excluded from outbound traffic redirection via the Pipy sidecar proxy.
Confirm FSM’s fsm-init init container spec has rules corresponding to the configured outbound IP ranges to exclude.
kubectl describe pod test-58d4f8ff58-wtz4f -n test
Name: test-58d4f8ff58-wtz4f
Namespace: test
...
...
Init Containers:
fsm-init:
Container ID: containerd://98840f655f2310b2f441e11efe9dfcf894e4c57e4e26b928542ee698159100c0
Image: flomesh/init:2c18593efc7a31986a6ae7f412e73b6067e11a57
Image ID: docker.io/flomesh/init@sha256:24456a8391bce5d254d5a1d557d0c5e50feee96a48a9fe4c622036f4ab2eaf8e
Port: <none>
Host Port: <none>
Command:
/bin/sh
Args:
-c
iptables -t nat -N PROXY_INBOUND && iptables -t nat -N PROXY_IN_REDIRECT && iptables -t nat -N PROXY_OUTPUT && iptables -t nat -N PROXY_REDIRECT && iptables -t nat -A PROXY_REDIRECT -p tcp -j REDIRECT --to-port 15001 && iptables -t nat -A PROXY_REDIRECT -p tcp --dport 15000 -j ACCEPT && iptables -t nat -A OUTPUT -p tcp -j PROXY_OUTPUT && iptables -t nat -A PROXY_OUTPUT -m owner --uid-owner 1500 -j RETURN && iptables -t nat -A PROXY_OUTPUT -d 127.0.0.1/32 -j RETURN && iptables -t nat -A PROXY_OUTPUT -j PROXY_REDIRECT && iptables -t nat -A PROXY_IN_REDIRECT -p tcp -j REDIRECT --to-port 15003 && iptables -t nat -A PREROUTING -p tcp -j PROXY_INBOUND && iptables -t nat -A PROXY_INBOUND -p tcp --dport 15010 -j RETURN && iptables -t nat -A PROXY_INBOUND -p tcp --dport 15901 -j RETURN && iptables -t nat -A PROXY_INBOUND -p tcp --dport 15902 -j RETURN && iptables -t nat -A PROXY_INBOUND -p tcp --dport 15903 -j RETURN && iptables -t nat -A PROXY_INBOUND -p tcp -j PROXY_IN_REDIRECT && iptables -t nat -I PROXY_OUTPUT -d 1.1.1.1/32 -j RETURN && && iptables -t nat -I PROXY_OUTPUT -d 2.2.2.2/24 -j RETURN
State: Terminated
Reason: Completed
Exit Code: 0
Started: Mon, 22 Mar 2021 09:26:14 -0700
Finished: Mon, 22 Mar 2021 09:26:14 -0700
Ready: True
Restart Count: 0
Environment: <none>
Mounts:
/var/run/secrets/kubernetes.io/serviceaccount from frontend-token-5g488 (ro)
In the example above, the following iptables commands are responsible for explicitly ignoring the configured outbound IP ranges (1.1.1.1/32 and 2.2.2.2/24) from being redirected to the Pipy proxy sidecar.
iptables -t nat -I PROXY_OUTPUT -d 1.1.1.1/32 -j RETURN
iptables -t nat -I PROXY_OUTPUT -d 2.2.2.2/24 -j RETURN
When outbound port exclusions are configured
By default, all traffic using TCP as the underlying transport protocol are redirected via the Pipy proxy sidecar container. This means all TCP based outbound traffic from applications are redirected and routed via the Pipy proxy sidecar based on service mesh policies. When outbound port exclusions are configured, traffic belonging to these ports will not be proxied to the Pipy sidecar.
If outbound ports are configured to be excluded but being subject to service mesh policies, verify they are configured as expected.
1. Confirm global outbound ports are correctly configured in the fsm-mesh-config MeshConfig resource
Confirm the outbound ports to be excluded are set correctly:
# Assumes FSM is installed in the fsm-system namespace
kubectl get meshconfig fsm-mesh-config -n fsm-system -o jsonpath='{.spec.traffic.outboundPortExclusionList}{"\n"}'
[6379,7070]
The output shows the ports that are excluded from outbound traffic redirection, [6379,7070] in the example above.
2. Confirm pod level outbound ports are correctly annotated on the pod
Confirm the outbound ports to be excluded on a pod are set correctly:
kubectl get pod POD_NAME -o jsonpath='{.metadata.annotations}' -n POD_NAMESPACE'
map[flomesh.io/outbound-port-exclusion-list:8080]
The output shows the ports that are excluded from outbound traffic redirection on the pod, 8080 in the example above.
3. Confirm outbound ports are included in init container spec
When outbound port exclusions are configured, FSM’s fsm-injector service reads this configuration from the fsm-mesh-config MeshConfig resource and from the annotations on the pod, and programs iptables rules corresponding to these ranges so that they are excluded from outbound traffic redirection via the Pipy sidecar proxy.
Confirm FSM’s fsm-init init container spec has rules corresponding to the configured outbound ports to exclude.
kubectl describe pod test-58d4f8ff58-wtz4f -n test
Name: test-58d4f8ff58-wtz4f
Namespace: test
...
...
Init Containers:
fsm-init:
Container ID: containerd://98840f655f2310b2f441e11efe9dfcf894e4c57e4e26b928542ee698159100c0
Image: flomesh/init:2c18593efc7a31986a6ae7f412e73b6067e11a57
Image ID: docker.io/flomesh/init@sha256:24456a8391bce5d254d5a1d557d0c5e50feee96a48a9fe4c622036f4ab2eaf8e
Port: <none>
Host Port: <none>
Command:
/bin/sh
Args:
-c
iptables-restore --noflush <<EOF
# FSM sidecar interception rules
*nat
:fsm_PROXY_INBOUND - [0:0]
:fsm_PROXY_IN_REDIRECT - [0:0]
:fsm_PROXY_OUTBOUND - [0:0]
:fsm_PROXY_OUT_REDIRECT - [0:0]
-A fsm_PROXY_IN_REDIRECT -p tcp -j REDIRECT --to-port 15003
-A PREROUTING -p tcp -j fsm_PROXY_INBOUND
-A fsm_PROXY_INBOUND -p tcp --dport 15010 -j RETURN
-A fsm_PROXY_INBOUND -p tcp --dport 15901 -j RETURN
-A fsm_PROXY_INBOUND -p tcp --dport 15902 -j RETURN
-A fsm_PROXY_INBOUND -p tcp --dport 15903 -j RETURN
-A fsm_PROXY_INBOUND -p tcp --dport 15904 -j RETURN
-A fsm_PROXY_INBOUND -p tcp -j fsm_PROXY_IN_REDIRECT
-I fsm_PROXY_INBOUND -i net1 -j RETURN
-I fsm_PROXY_INBOUND -i net2 -j RETURN
-A fsm_PROXY_OUT_REDIRECT -p tcp -j REDIRECT --to-port 15001
-A fsm_PROXY_OUT_REDIRECT -p tcp --dport 15000 -j ACCEPT
-A OUTPUT -p tcp -j fsm_PROXY_OUTBOUND
-A fsm_PROXY_OUTBOUND -o lo ! -d 127.0.0.1/32 -m owner --uid-owner 1500 -j fsm_PROXY_IN_REDIRECT
-A fsm_PROXY_OUTBOUND -o lo -m owner ! --uid-owner 1500 -j RETURN
-A fsm_PROXY_OUTBOUND -m owner --uid-owner 1500 -j RETURN
-A fsm_PROXY_OUTBOUND -d 127.0.0.1/32 -j RETURN
-A fsm_PROXY_OUTBOUND -o net1 -j RETURN
-A fsm_PROXY_OUTBOUND -o net2 -j RETURN
-A fsm_PROXY_OUTBOUND -j fsm_PROXY_OUT_REDIRECT
COMMIT
EOF
State: Terminated
Reason: Completed
Exit Code: 0
Started: Mon, 22 Mar 2021 09:26:14 -0700
Finished: Mon, 22 Mar 2021 09:26:14 -0700
Ready: True
Restart Count: 0
Environment: <none>
Mounts:
/var/run/secrets/kubernetes.io/serviceaccount from frontend-token-5g488 (ro)
In the example above, the following iptables commands are responsible for explicitly ignoring the configured outbound ports (6379, 7070 and 8080) from being redirected to the Pipy proxy sidecar.
iptables -t nat -I PROXY_OUTPUT -p tcp --match multiport --dports 6379,7070,8080 -j RETURN
8.6.2 - Permissive Traffic Policy Mode
When permissive traffic policy mode is not working as expected
1. Confirm permissive traffic policy mode is enabled
Confirm permissive traffic policy mode is enabled by verifying the value for the enablePermissiveTrafficPolicyMode key in the fsm-mesh-config custom resource. fsm-mesh-config MeshConfig resides in the namespace FSM control plane namespace (fsm-system by default).
# Returns true if permissive traffic policy mode is enabled
kubectl get meshconfig fsm-mesh-config -n fsm-system -o jsonpath='{.spec.traffic.enablePermissiveTrafficPolicyMode}{"\n"}'
true
The above command must return a boolean string (true or false) indicating if permissive traffic policy mode is enabled.
2. Inspect FSM controller logs for errors
# When fsm-controller is deployed in the fsm-system namespace
kubectl logs -n fsm-system $(kubectl get pod -n fsm-system -l app=fsm-controller -o jsonpath='{.items[0].metadata.name}')
Errors will be logged with the level key in the log message set to error:
{"level":"error","component":"...","time":"...","file":"...","message":"..."}
3. Confirm the Pipy configuration
Use the fsm verify connectivity command to validate that the pods can communicate using a Kubernetes service.
For example, to verify if the pod curl-7bb5845476-zwxbt in the namespace curl can direct traffic to the pod httpbin-69dc7d545c-n7pjb in the httpbin namespace using the httpbin Kubernetes service:
fsm verify connectivity --from-pod curl/curl-7bb5845476-zwxbt --to-pod httpbin/httpbin-69dc7d545c-n7pjb --to-service httpbin
---------------------------------------------
[+] Context: Verify if pod "curl/curl-7bb5845476-zwxbt" can access pod "httpbin/httpbin-69dc7d545c-n7pjb" for service "httpbin/httpbin"
Status: Success
---------------------------------------------
The Status field in the output will indicate Success when the verification succeeds.
8.6.3 - Ingress
When Ingress is not working as expected
1. Confirm global ingress configuration is set as expected.
# Returns true if HTTPS ingress is enabled
kubectl get meshconfig fsm-mesh-config -n fsm-system -o jsonpath='{.spec.traffic.useHTTPSIngress}{"\n"}'
false
If the output of this command is false this means that HTTP ingress is enabled and HTTPS ingress is disabled. To disable HTTP ingress and enable HTTPS ingress, use the following command:
# Replace fsm-system with fsm-controller's namespace if using a non default namespace
kubectl patch meshconfig fsm-mesh-config -n fsm-system -p '{"spec":{"traffic":{"useHTTPSIngress":true}}}' --type=merge
Likewise, to enable HTTP ingress and disable HTTPS ingress, run:
# Replace fsm-system with fsm-controller's namespace if using a non default namespace
kubectl patch meshconfig fsm-mesh-config -n fsm-system -p '{"spec":{"traffic":{"useHTTPSIngress":false}}}' --type=merge
2. Inspect FSM controller logs for errors
# When fsm-controller is deployed in the fsm-system namespace
kubectl logs -n fsm-system $(kubectl get pod -n fsm-system -l app=fsm-controller -o jsonpath='{.items[0].metadata.name}')
Errors will be logged with the level key in the log message set to error:
{"level":"error","component":"...","time":"...","file":"...","message":"..."}
3. Confirm that the ingress resource has been successfully deployed
kubectl get ingress <ingress-name> -n <ingress-namespace>
8.6.4 - Egress Troubleshooting
When Egress is not working as expected
1. Confirm egress is enabled
Confirm egress is enabled by verifying the value for the enableEgress key in the fsm-mesh-config MeshConfig custom resource. fsm-mesh-config resides in the namespace FSM control plane namespace (fsm-system by default).
# Returns true if egress is enabled
kubectl get meshconfig fsm-mesh-config -n fsm-system -o jsonpath='{.spec.traffic.enableEgress}{"\n"}'
true
The above command must return a boolean string (true or false) indicating if egress is enabled.
2. Inspect FSM controller logs for errors
# When fsm-controller is deployed in the fsm-system namespace
kubectl logs -n fsm-system $(kubectl get pod -n fsm-system -l app=fsm-controller -o jsonpath='{.items[0].metadata.name}')
Errors will be logged with the level key in the log message set to error:
{"level":"error","component":"...","time":"...","file":"...","message":"..."}
3. Confirm the Pipy configuration
Check that egress is enabled in the configuration used by the Pod’s sidecar.
{
"Spec": {
"SidecarLogLevel": "error",
"Traffic": {
"EnableEgress": true
}
}
}
9 - Data plane benchmark
9.1 - Service Mesh Data Plane Benchmark
Flomesh Service Mesh (FSM) aims to provide service mesh functionality with a focus on high performance and low resource consumption. This allows resource-constrained edge environments to leverage service mesh functionality similar to the cloud.
In this test, benchmarks were conducted for FSM (v1.1.4) and Istio (v1.19.3). The primary focus is on the service latency distribution when using two different meshes and monitoring the resource overhead of the data plane.
FSM uses Pipy as the data plane, while Istio uses Envoy.
Before testing, it is important to note that the focus is on comparing latency and resource consumption between them, rather than extreme performance.
Testing Environment
The benchmark was tested in a Kubernetes cluster running on Azure Cloud VM. The cluster consists of 2 Standard_D8_v3 nodes. FSM and Istio are both configured with loose traffic mode and mTLS, while other settings are set to default.
- Kubernetes: K3s v1.24.17+k3s1
- OS: Ubuntu 20.04
- Nodes: 8c32g * 2
- Sidecar: 1c512Mi
The test tool is located on the branch fsm of this repository, which is forked from istio/tools.
Procedure
The procedure is documented in this file.
In the test tool, there are two applications: fortioclient and fortioserver. The load is generated by fortioclient triggered with kubectl exec.
For both meshes, tests are conducted for baseline (no sidecar) and both (two sidecars) modes. Load is generated with 2, 4, 8, 16, 32, 64 concurrencies at QPS 1000. You can review the benchmark configs for FSM and Istio.
An essential aspect is setting the request and limit resource to 1000m and 512Mi.
Latency
**Illustration: xxx_baseline means that the service is accessed directly without sidecar; xxx_both means that both the client and the server have sidecars. **
The X-axis represents the number of concurrencies; the Y-axis represents latency in milliseconds
P50
P90
P99
P999
Resource Consumption
Among them, the CPU consumption of Istio and FSM is higher when there are two concurrencies. It is speculated that the reason is that there is no preheating before the test starts.
Client sidecar cpu
Server sidecar cpu
Client sidecar memory
Server sidecar memory
Summary
This time, we benchmarked FSM and Istio data planes with limited sidecar resources.
- Latency: The latency of FSM’s Pipy sidecar proxy is lower than Istio’s Envoy, especially under high concurrency.
- Resource consumption: With only 2 services, FSM’s Pipy consumes less resources than Istio’s Envoy.
From the results, FSM can still maintain high performance with low resource usage and more efficient use of resources. So FSM is particularly suitable for resource-constrained and large-scale scenarios, reducing costs effectively.. These are made possible by Pipy’s low-resource, high-performance features.
Of course, while FSM is suitable for cloud, it can also be applied to edge computing scenarios.