This is the multi-page printable view of this section. Click here to print.
Observability
1 - Distributed Tracing Collaboration between FSM and OpenTelemetry
This doc shows you the example bring your own (BYO) tracing colloctor for distributed tracing. The OpenTelemetry Collector works as the tracing collector to aggregate spans and sinks to Jaeger (in this example) or other system.
Prerequisites
- Kubernetes cluster running Kubernetes v1.19.0 or greater.
- FSM installed on the Kubernetes cluster.
kubectlinstalled and access to the cluster’s API server.fsmCLI installed.
Jaeger
For the sake of demonstration, we use the jaegertracing/all-in-one image to deploy Jaeger here. This image includes components such as the Jaeger collector, memory storage, query service, and UI, making it very suitable for development and testing.
Enable support for OTLP (OpenTelemetry Protocol) through the environment variable COLLECTOR_OTLP_ENABLED.
kubectl apply -f - <<EOF
apiVersion: apps/v1
kind: Deployment
metadata:
  name: jaeger
spec:
  replicas: 1
  selector:
    matchLabels:
      app: jaeger
  template:
    metadata:
      labels:
        app: jaeger
    spec:
      containers:
      - name: jaeger
        image: jaegertracing/all-in-one:latest
        env:
        - name: COLLECTOR_OTLP_ENABLED
          value: "true"
        ports:
        - containerPort: 16686
        - containerPort: 14268
---
apiVersion: v1
kind: Service
metadata:
  name: jaeger
spec:
  selector:
    app: jaeger
  type: ClusterIP
  ports:
    - name: ui
      port: 16686
      targetPort: 16686
    - name: collector
      port: 14268
      targetPort: 14268
    - name: http
      protocol: TCP
      port: 4318
      targetPort: 4318
    - name: grpc
      protocol: TCP
      port: 4317
      targetPort: 4317
EOF
Install cert-manager
The Otel Operator relies on cert-manager for certificate management, and cert-manager needs to be installed before installing the operator.
kubectl apply -f https://github.com/cert-manager/cert-manager/releases/download/v1.13.2/cert-manager.yaml
Install OpenTelemetry Operator
Execute the following command to install Otel Operator.
kubectl apply -f https://github.com/open-telemetry/opentelemetry-operator/releases/latest/download/opentelemetry-operator.yaml
Configuring OpenTelemetry Collector
For detailed configuration of the Otel collector, refer to the official documentation.
- Receivers: configure
otlpto receive tracing information from applications, andzipkinto receive reports from sidecar, using endpoint0.0.0.0:9411. - Exporters: configure Jager’s otlp endpoint
jaeger.default:4317. - Pipeline services: use
otlpandzipkinas input sources, directing output to jaeger.
kubectl apply -f - <<EOF
apiVersion: opentelemetry.io/v1alpha1
kind: OpenTelemetryCollector
metadata:
  name: otel
spec:
  config: |
    receivers:
      zipkin:
        endpoint: "0.0.0.0:9411"

    exporters:
      otlp/jaeger:
        endpoint: "jaeger.default:4317"
        tls:
          insecure: true

    service:
      pipelines:
        traces:
          receivers: [zipkin]
          exporters: [otlp/jaeger]
EOF
Update Mesh Configuration
In order to aggregate spans to OpenTelemetry Collector, we need to let mesh know the address of aggregator.
Following the FSM Tracing Doc, we can enable it during installation or update the configuration after installed.
kubectl patch meshconfig fsm-mesh-config -n fsm-system -p '{"spec":{"observability":{"tracing":{"enable":true,"address": "otel-collector.default","port":9411,"endpoint":"/api/v2/spans"}}}}' --type=merge
Deploy Sample Application
kubectl create namespace bookstore
kubectl create namespace bookbuyer
kubectl create namespace bookthief
kubectl create namespace bookwarehouse
fsm namespace add bookstore bookbuyer bookthief bookwarehouse
kubectl apply -f https://raw.githubusercontent.com/flomesh-io/fsm-docs/main/manifests/apps/bookbuyer.yaml
kubectl apply -f https://raw.githubusercontent.com/flomesh-io/fsm-docs/main/manifests/apps/bookthief.yaml
kubectl apply -f https://raw.githubusercontent.com/flomesh-io/fsm-docs/main/manifests/apps/bookstore.yaml
kubectl apply -f https://raw.githubusercontent.com/flomesh-io/fsm-docs/main/manifests/apps/bookwarehouse.yaml
kubectl apply -f https://raw.githubusercontent.com/flomesh-io/fsm-docs/main/manifests/apps/mysql.yaml
Check Tracing
Check the Jaeger UI and you will get the tracing data there.
jaeger_pod="$(kubectl get pod -l app=jaeger -o jsonpath='{.items[0].metadata.name}')" default ⎈
kubectl port-forward $jaeger_pod 16686:16686 &
2 - Integrate FSM with Prometheus and Grafana
The following article shows you how to create an example bring your own (BYO) Prometheus and Grafana stack on your cluster and configure that stack for observability and monitoring of FSM. For an example using an automatic provisioning of a Prometheus and Grafana stack with FSM, see the Observability getting started guide.
IMPORTANT: The configuration created in this article should not be used in production environments. For production-grade deployments, see Prometheus Operator and Deploy Grafana in Kubernetes.
Prerequisites
- Kubernetes cluster running Kubernetes v1.19.0 or greater.
- FSM installed on the Kubernetes cluster.
kubectlinstalled and access to the cluster’s API server.fsmCLI installed.helmCLI installed.
Deploy an example Prometheus instance
Use helm to deploy a Prometheus instance to your cluster in the default namespace.
helm repo add prometheus-community https://prometheus-community.github.io/helm-charts
helm repo update
helm install stable prometheus-community/prometheus
The output of the helm install command contains the DNS name of the Prometheus server. For example:
...
The Prometheus server can be accessed via port 80 on the following DNS name from within your cluster:
stable-prometheus-server.metrics.svc.cluster.local
...
Record this DNS name for use in a later step.
Configure Prometheus for FSM
Prometheus needs to be configured to scape the FSM endpoints and properly handle FSM’s labeling, relabelling, and endpoint configuration. This configuration also helps the FSM Grafana dashboards, which are configured in a later step, properly display the data scraped from FSM.
Use kubectl get configmap to verify the stable-prometheus-sever configmap has been created. For example:
kubectl get configmap

NAME                             DATA   AGE
...
stable-prometheus-alertmanager   1      18m
stable-prometheus-server         5      18m
...
Create update-prometheus-configmap.yaml with the following:
apiVersion: v1
kind: ConfigMap
metadata:
  name: stable-prometheus-server
data:
  prometheus.yml: |
    global:
      scrape_interval: 15s
      scrape_timeout: 15s
      evaluation_interval: 30s

    scrape_configs:
      - job_name: 'kubernetes-apiservers'
        kubernetes_sd_configs:
        - role: endpoints
        scheme: https
        tls_config:
          ca_file: /var/run/secrets/kubernetes.io/serviceaccount/ca.crt
          # TODO need to remove this when the CA and SAN match
          insecure_skip_verify: true
        bearer_token_file: /var/run/secrets/kubernetes.io/serviceaccount/token
        metric_relabel_configs:
        - source_labels: [__name__]
          regex: '(apiserver_watch_events_total|apiserver_admission_webhook_rejection_count)'
          action: keep
        relabel_configs:
        - source_labels: [__meta_kubernetes_namespace, __meta_kubernetes_service_name, __meta_kubernetes_endpoint_port_name]
          action: keep
          regex: default;kubernetes;https

      - job_name: 'kubernetes-nodes'
        scheme: https
        tls_config:
          ca_file: /var/run/secrets/kubernetes.io/serviceaccount/ca.crt
        bearer_token_file: /var/run/secrets/kubernetes.io/serviceaccount/token
        kubernetes_sd_configs:
        - role: node
        relabel_configs:
        - action: labelmap
          regex: __meta_kubernetes_node_label_(.+)
        - target_label: __address__
          replacement: kubernetes.default.svc:443
        - source_labels: [__meta_kubernetes_node_name]
          regex: (.+)
          target_label: __metrics_path__
          replacement: /api/v1/nodes/${1}/proxy/metrics

      - job_name: 'kubernetes-pods'
        kubernetes_sd_configs:
        - role: pod
        metric_relabel_configs:
        - source_labels: [__name__]
          regex: '(sidecar_server_live|sidecar_cluster_health_check_.*|sidecar_cluster_upstream_rq_xx|sidecar_cluster_upstream_cx_active|sidecar_cluster_upstream_cx_tx_bytes_total|sidecar_cluster_upstream_cx_rx_bytes_total|sidecar_cluster_upstream_rq_total|sidecar_cluster_upstream_cx_destroy_remote_with_active_rq|sidecar_cluster_upstream_cx_connect_timeout|sidecar_cluster_upstream_cx_destroy_local_with_active_rq|sidecar_cluster_upstream_rq_pending_failure_eject|sidecar_cluster_upstream_rq_pending_overflow|sidecar_cluster_upstream_rq_timeout|sidecar_cluster_upstream_rq_rx_reset|^fsm.*)'
          action: keep
        relabel_configs:
        - source_labels: [__meta_kubernetes_pod_annotation_prometheus_io_scrape]
          action: keep
          regex: true
        - source_labels: [__meta_kubernetes_pod_annotation_prometheus_io_path]
          action: replace
          target_label: __metrics_path__
          regex: (.+)
        - source_labels: [__address__, __meta_kubernetes_pod_annotation_prometheus_io_port]
          action: replace
          regex: ([^:]+)(?::\d+)?;(\d+)
          replacement: $1:$2
          target_label: __address__
        - source_labels: [__meta_kubernetes_namespace]
          action: replace
          target_label: source_namespace
        - source_labels: [__meta_kubernetes_pod_name]
          action: replace
          target_label: source_pod_name
        - regex: '(__meta_kubernetes_pod_label_app)'
          action: labelmap
          replacement: source_service
        - regex: '(__meta_kubernetes_pod_label_fsm_sidecar_uid|__meta_kubernetes_pod_label_pod_template_hash|__meta_kubernetes_pod_label_version)'
          action: drop
        # for non-ReplicaSets (DaemonSet, StatefulSet)
        # __meta_kubernetes_pod_controller_kind=DaemonSet
        # __meta_kubernetes_pod_controller_name=foo
        # =>
        # workload_kind=DaemonSet
        # workload_name=foo
        - source_labels: [__meta_kubernetes_pod_controller_kind]
          action: replace
          target_label: source_workload_kind
        - source_labels: [__meta_kubernetes_pod_controller_name]
          action: replace
          target_label: source_workload_name
        # for ReplicaSets
        # __meta_kubernetes_pod_controller_kind=ReplicaSet
        # __meta_kubernetes_pod_controller_name=foo-bar-123
        # =>
        # workload_kind=Deployment
        # workload_name=foo-bar
        # deplyment=foo
        - source_labels: [__meta_kubernetes_pod_controller_kind]
          action: replace
          regex: ^ReplicaSet$
          target_label: source_workload_kind
          replacement: Deployment
        - source_labels:
          - __meta_kubernetes_pod_controller_kind
          - __meta_kubernetes_pod_controller_name
          action: replace
          regex: ^ReplicaSet;(.*)-[^-]+$
          target_label: source_workload_name

      - job_name: 'smi-metrics'
        kubernetes_sd_configs:
        - role: pod
        relabel_configs:
        - source_labels: [__meta_kubernetes_pod_annotation_prometheus_io_scrape]
          action: keep
          regex: true
        - source_labels: [__meta_kubernetes_pod_annotation_prometheus_io_path]
          action: replace
          target_label: __metrics_path__
          regex: (.+)
        - source_labels: [__address__, __meta_kubernetes_pod_annotation_prometheus_io_port]
          action: replace
          regex: ([^:]+)(?::\d+)?;(\d+)
          replacement: $1:$2
          target_label: __address__
        metric_relabel_configs:
        - source_labels: [__name__]
          regex: 'sidecar_.*fsm_request_(total|duration_ms_(bucket|count|sum))'
          action: keep
        - source_labels: [__name__]
          action: replace
          regex: sidecar_response_code_(\d{3})_source_namespace_.*_source_kind_.*_source_name_.*_source_pod_.*_destination_namespace_.*_destination_kind_.*_destination_name_.*_destination_pod_.*_fsm_request_total
          target_label: response_code
        - source_labels: [__name__]
          action: replace
          regex: sidecar_response_code_\d{3}_source_namespace_(.*)_source_kind_.*_source_name_.*_source_pod_.*_destination_namespace_.*_destination_kind_.*_destination_name_.*_destination_pod_.*_fsm_request_total
          target_label: source_namespace
        - source_labels: [__name__]
          action: replace
          regex: sidecar_response_code_\d{3}_source_namespace_.*_source_kind_(.*)_source_name_.*_source_pod_.*_destination_namespace_.*_destination_kind_.*_destination_name_.*_destination_pod_.*_fsm_request_total
          target_label: source_kind
        - source_labels: [__name__]
          action: replace
          regex: sidecar_response_code_\d{3}_source_namespace_.*_source_kind_.*_source_name_(.*)_source_pod_.*_destination_namespace_.*_destination_kind_.*_destination_name_.*_destination_pod_.*_fsm_request_total
          target_label: source_name
        - source_labels: [__name__]
          action: replace
          regex: sidecar_response_code_\d{3}_source_namespace_.*_source_kind_.*_source_name_.*_source_pod_(.*)_destination_namespace_.*_destination_kind_.*_destination_name_.*_destination_pod_.*_fsm_request_total
          target_label: source_pod
        - source_labels: [__name__]
          action: replace
          regex: sidecar_response_code_\d{3}_source_namespace_.*_source_kind_.*_source_name_.*_source_pod_.*_destination_namespace_(.*)_destination_kind_.*_destination_name_.*_destination_pod_.*_fsm_request_total
          target_label: destination_namespace
        - source_labels: [__name__]
          action: replace
          regex: sidecar_response_code_\d{3}_source_namespace_.*_source_kind_.*_source_name_.*_source_pod_.*_destination_namespace_.*_destination_kind_(.*)_destination_name_.*_destination_pod_.*_fsm_request_total
          target_label: destination_kind
        - source_labels: [__name__]
          action: replace
          regex: sidecar_response_code_\d{3}_source_namespace_.*_source_kind_.*_source_name_.*_source_pod_.*_destination_namespace_.*_destination_kind_.*_destination_name_(.*)_destination_pod_.*_fsm_request_total
          target_label: destination_name
        - source_labels: [__name__]
          action: replace
          regex: sidecar_response_code_\d{3}_source_namespace_.*_source_kind_.*_source_name_.*_source_pod_.*_destination_namespace_.*_destination_kind_.*_destination_name_.*_destination_pod_(.*)_fsm_request_total
          target_label: destination_pod
        - source_labels: [__name__]
          action: replace
          regex: .*(fsm_request_total)
          target_label: __name__

        - source_labels: [__name__]
          action: replace
          regex: sidecar_source_namespace_(.*)_source_kind_.*_source_name_.*_source_pod_.*_destination_namespace_.*_destination_kind_.*_destination_name_.*_destination_pod_.*_fsm_request_duration_ms_(bucket|sum|count)
          target_label: source_namespace
        - source_labels: [__name__]
          action: replace
          regex: sidecar_source_namespace_.*_source_kind_(.*)_source_name_.*_source_pod_.*_destination_namespace_.*_destination_kind_.*_destination_name_.*_destination_pod_.*_fsm_request_duration_ms_(bucket|sum|count)
          target_label: source_kind
        - source_labels: [__name__]
          action: replace
          regex: sidecar_source_namespace_.*_source_kind_.*_source_name_(.*)_source_pod_.*_destination_namespace_.*_destination_kind_.*_destination_name_.*_destination_pod_.*_fsm_request_duration_ms_(bucket|sum|count)
          target_label: source_name
        - source_labels: [__name__]
          action: replace
          regex: sidecar_source_namespace_.*_source_kind_.*_source_name_.*_source_pod_(.*)_destination_namespace_.*_destination_kind_.*_destination_name_.*_destination_pod_.*_fsm_request_duration_ms_(bucket|sum|count)
          target_label: source_pod
        - source_labels: [__name__]
          action: replace
          regex: sidecar_source_namespace_.*_source_kind_.*_source_name_.*_source_pod_.*_destination_namespace_(.*)_destination_kind_.*_destination_name_.*_destination_pod_.*_fsm_request_duration_ms_(bucket|sum|count)
          target_label: destination_namespace
        - source_labels: [__name__]
          action: replace
          regex: sidecar_source_namespace_.*_source_kind_.*_source_name_.*_source_pod_.*_destination_namespace_.*_destination_kind_(.*)_destination_name_.*_destination_pod_.*_fsm_request_duration_ms_(bucket|sum|count)
          target_label: destination_kind
        - source_labels: [__name__]
          action: replace
          regex: sidecar_source_namespace_.*_source_kind_.*_source_name_.*_source_pod_.*_destination_namespace_.*_destination_kind_.*_destination_name_(.*)_destination_pod_.*_fsm_request_duration_ms_(bucket|sum|count)
          target_label: destination_name
        - source_labels: [__name__]
          action: replace
          regex: sidecar_source_namespace_.*_source_kind_.*_source_name_.*_source_pod_.*_destination_namespace_.*_destination_kind_.*_destination_name_.*_destination_pod_(.*)_fsm_request_duration_ms_(bucket|sum|count)
          target_label: destination_pod
        - source_labels: [__name__]
          action: replace
          regex: .*(fsm_request_duration_ms_(bucket|sum|count))
          target_label: __name__

      - job_name: 'kubernetes-cadvisor'
        scheme: https
        tls_config:
          ca_file: /var/run/secrets/kubernetes.io/serviceaccount/ca.crt
        bearer_token_file: /var/run/secrets/kubernetes.io/serviceaccount/token
        kubernetes_sd_configs:
        - role: node
        metric_relabel_configs:
        - source_labels: [__name__]
          regex: '(container_cpu_usage_seconds_total|container_memory_rss)'
          action: keep
        relabel_configs:
        - action: labelmap
          regex: __meta_kubernetes_node_label_(.+)
        - target_label: __address__
          replacement: kubernetes.default.svc:443
        - source_labels: [__meta_kubernetes_node_name]
          regex: (.+)
          target_label: __metrics_path__
          replacement: /api/v1/nodes/${1}/proxy/metrics/cadvisor
Use kubectl apply to update the Prometheus server configmap.
kubectl apply -f update-prometheus-configmap.yaml
Verify Prometheus is able to scrape the FSM mesh and API endpoints by using kubectl port-forward to forward the traffic between the Prometheus management application and your development computer.
export POD_NAME=$(kubectl get pods -l "app=prometheus,component=server" -o jsonpath="{.items[0].metadata.name}")
kubectl port-forward $POD_NAME 9090
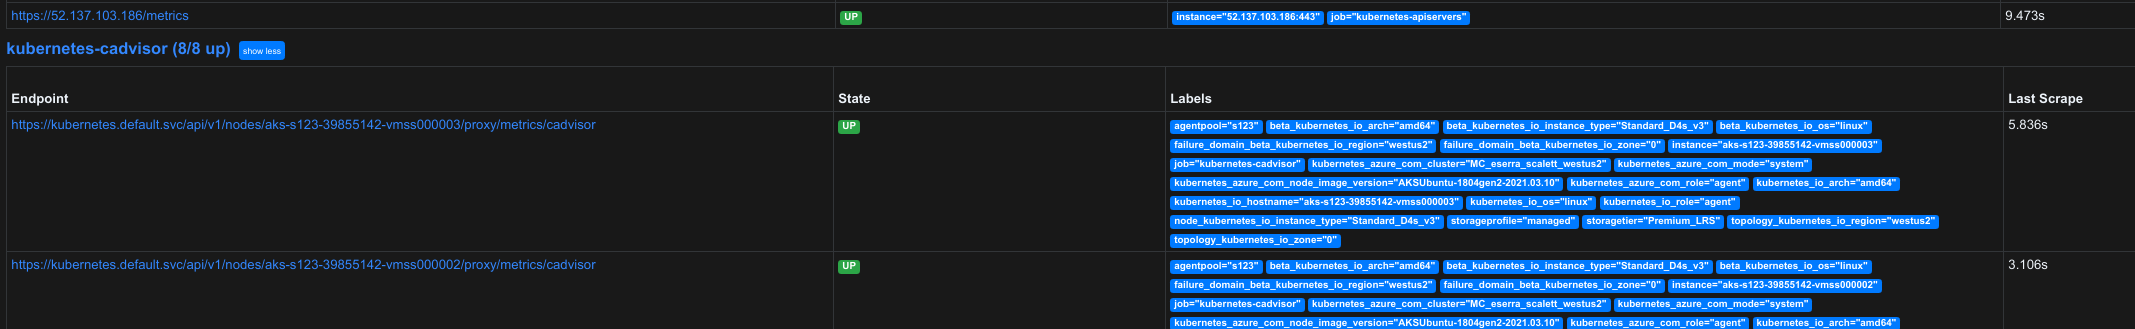
Open a web browser to http://localhost:9090/targets to access the Prometheus management application and verify the endpoints are connected, up, and scrapping is running.
Stop the port-forwarding command.
Deploying a Grafana Instance
Use helm to deploy a Grafana instance to your cluster in the default namespace.
helm repo add grafana https://grafana.github.io/helm-charts
helm repo update
helm install grafana/grafana --generate-name
Use kubectl get secret to display the administrator password for Grafana.
export SECRET_NAME=$(kubectl get secret -l "app.kubernetes.io/name=grafana" -o jsonpath="{.items[0].metadata.name}")
kubectl get secret $SECRET_NAME -o jsonpath="{.data.admin-password}" | base64 --decode ; echo
Use kubectl port-forward to forward the traffic between the Grafana’s management application and your development computer.
export POD_NAME=$(kubectl get pods -l "app.kubernetes.io/name=grafana" -o jsonpath="{.items[0].metadata.name}")
kubectl port-forward $POD_NAME 3000
Open a web browser to http://localhost:3000 to access the Grafana’s management application. Use admin as the username and administrator password from the previous step. and verify the endpoints are connected, up, and scrapping is running.
From the management application:
- Select
SettingsthenData Sources. - Select
Add data source. - Find the
Prometheusdata source and selectSelect. - Enter the DNS name, for example
stable-prometheus-server.default.svc.cluster.local, from the earlier step inURL.
Select Save and Test and confirm you see Data source is working.
Importing FSM Dashboards
FSM Dashboards are available through FSM GitHub repository, which can be imported as json blobs on the management application.
To import a dashboard:
- Hover your cursor over the
+and selectImport. - Copy the JSON from the fsm-mesh-sidecar-details dashboard and paste it in
Import via panel json. - Select
Load. - Select
Import.
Confirm you see a Mesh and Sidecar Details dashboard created.